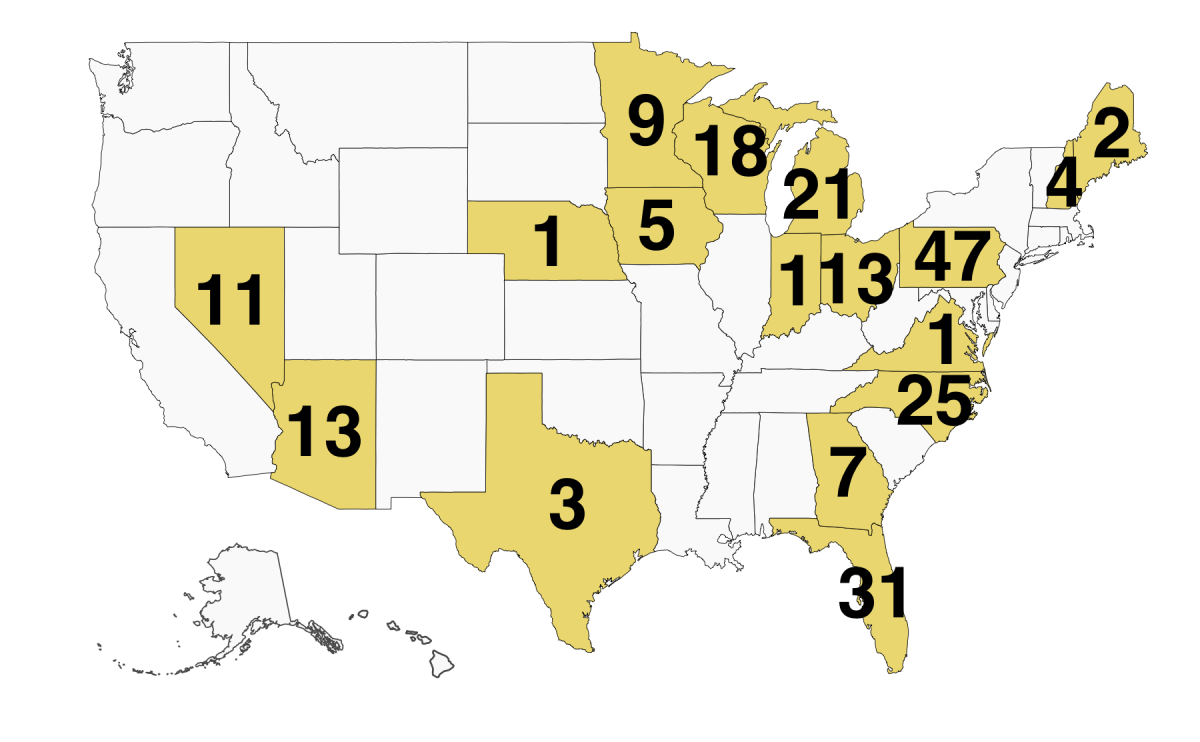
In 2020, 12 states have received 96% of the 2020 general-election campaign events (204 of 212) by the major-party presidential and vice-presidential candidates.
All of the 212 events were in just 17 states, meaning that 33 states and the District of Columbia did not receive any general-election campaign events at all.
Pennsylvania received 47 general-election campaign events -- the most of any state and 22% of the total. Florida received 31 events -- 15% of the total. Together, Pennsylvania and Florida received three-eighths of the entire presidential campaign.
FairVote created the database and this map of campaign activity. Click here to see details of the candidates' visits to various states. The map shows, by state, the number of campaign events starting on August 28, 2020 (the day after the end of the Republican National Convention) and ending on Tuesday November 3, 2020 (Election Day).
The reason why voters in only a handful of states matter in presidential races is that almost all states award all of their electoral votes to the candidate who gets the most votes inside the state. Because of these state winner-take-all laws, candidates have no reason to pay attention to voters unless they live in a state where the race is within a few percentage points.
Despite the pandemic, the total of 212 events in 2020 equaled 84% of the total number of events in 2012 -- the most recent election involving an incumbent President and Vice President.
The situation was similar in 2016 when 94% of the general-election campaign events (375 of the 399) were in a dozen states. Also, two-thirds of the events were in just 6 states (OH, FL, VA, NC, PA, MI).
And, the situation was similar in 2012. In 2012, 100% of the 253 events were in just 12 states. Two-thirds of the general-election campaign events were in four states (OH, FL, VA, IA).
The concentration of the 2020 campaign events in just a few battleground states is nothing new, and was predicted as early as summer 2019.
All the campaign activity has been in states that were rated as either "toss-up" or "leaning" toward one party by the Cook Political scorecard.
A total of 8 of the 212 events were scattered among 5 states, each of which received 1, 2, or 3 events.
- The single visit to Nebraska and the 2 events to Maine were motivated by the fact that those states award electoral votes by congressional district. Although the statewide result is not in doubt in either state, the 2nd congressional district of Nebraska (the Omaha area) and the 2nd congressional of Maine (the northern half of the state) were closely divided. These campaign events were held in those particular districts, and the remainder of both states received no attention.
- Concerning Trump's single visit to Virginia, as reported in Politico, this event was scheduled to reach nearby rural North Carolina counties, and Virginia was not considered a battleground state by either campaign.
- Concerning Indiana, Pence's single campaign event in his home state was apparently motivated by commitments to the local state party, and Indiana is not considered a battleground state by either campaign.
- Texas's 3 campaign events occurred late in the campaign when polling indicated that the state might be close.
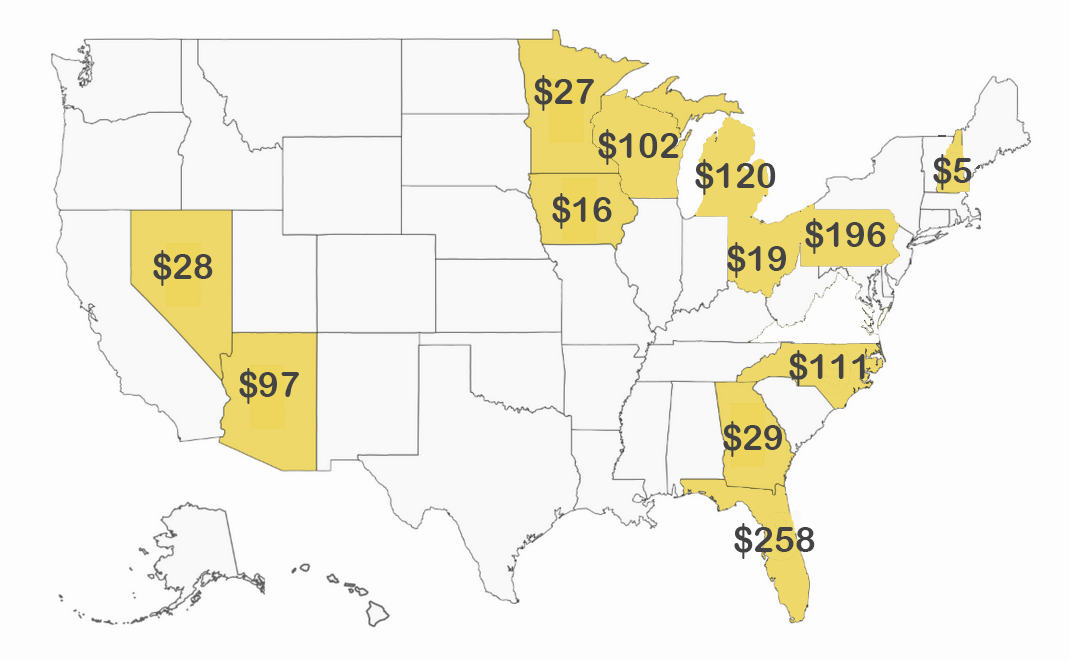
TV Ad Spending Was Similarly Concentrated in a Dozen or So Closely Divided Battleground States
Seven out of eight dollars for TV ads up to mid-October ($884,000,000 of $1,015,000,000) were spent in the same 6 states.The map below shows TV ad spending (in millions) by state, as reported by NPR up to mid-October.
The New York Times has a detailed state-by-state, week-by-week map