- 9.3.1 MYTH: Small states have increased clout under the current system.
- 9.3.2 MYTH: The small states give the Republican Party a systemic advantage in the Electoral College.
- 9.3.3 MYTH: Thirty-one states would lose power under a national popular vote.
- 9.3.4 MYTH: The small states are so small that they will not attract any attention under any system.
- 9.3.5 MYTH: The small states oppose a national popular vote for President.
- 9.3.6 MYTH: Equal representation of the states in the U.S. Senate is threatened by the National Popular Vote Compact.
9.3.1 MYTH: Small states have increased clout under the current system.
QUICK ANSWER:
- The current state-by-state winner-take-all method of awarding electoral votes extinguishes the influence of small states in presidential elections. The reason is that political power in presidential elections comes from being a closely divided battleground state. Almost all of the small states are non-competitive one-party states in presidential elections.
- The eight smallest states have about the same combined population (5.9 million) as Wisconsin (5.6 million). These eight smallest states have 24 electoral votes—more than twice Wisconsin’s 10 electoral votes. Because Wisconsin is a closely divided battleground state, it received a total of 58 of the nation’s 1,164 general-election campaign events in the four presidential elections between 2008 and 2020. In contrast, because the eight smallest states are all one-party states in presidential elections, all together they received only one visit in four elections.
The U.S. Constitution gives each state a number of electoral votes equal to the state’s number of U.S. Representatives (which are apportioned on the basis of each state’s population) plus the state’s number of U.S. Senators (two).
Defenders of the current system of electing the President repeatedly assert—with a straight face—that the current system gives small states increased clout in presidential elections.
Trent England, Executive Director of Save Our States, has written:
“The seven smallest states (Alaska, Delaware, Montana, North Dakota, South Dakota, Vermont, and Wyoming) and the District of Columbia each have three electoral votes. A national popular vote would render all low-population states almost permanently irrelevant in presidential political strategy.”[212] [Emphasis added]
Professor Robert Hardaway of the University of Denver Sturm College of Law has stated:
“If we had National Popular Vote, you take a state like Alaska, which has a very low population. If it was a national popular vote, no presidential candidate would be interested in going up there, because the population is so low. But, … if they have three electoral votes, that’s the compromise that brought this nation together, that’s a lot of votes, that’s a lot of electoral votes compared to the population, so you’ll see presidential candidates visiting some of those outlying areas.”[213] [Emphasis added]
Senator Mitch McConnell (R–Kentucky) has asked:
“If the only vote total that counted was just running up the score, query, when would be the next time if you had a state with one congressmen or two congressmen and you had a tiny population, when would be the next time you would see or hear from any candidate for president?”[214]
Economics Professor Walter E. Williams of George Mason University has said:
“Were we to choose the president and vice president under a popular vote … presidential candidates could safely ignore the interests of the citizens of Wyoming, Alaska, Vermont, North Dakota, South Dakota, Montana and Delaware.”[215] [Emphasis added]
Tara Ross, a lobbyist against the National Popular Vote Compact who works closely with Save Our States,[216], [217], [218]has testified at state legislative hearings in Delaware, Nevada, and elsewhere:
“Minority political interests, particularly the small states, are protected [by the current system].”
“Ultimately, the Electoral College ensures that the political parties must reach out to all the states.”
“NPV will lessen the need of presidential candidates to obtain the support of voters in rural areas and in small states.”[219] [Emphasis added]
Gary Gregg II of the University of Louisville and editor of Securing Democracy: Why We Have an Electoral College,[220] a book defending the current system, said that a national popular vote for President:
“would mean ignoring every rural and small-state voter in our country.”[221]
None of these statements is true.
The eight states with three electoral votes
The major-party nominees for President and Vice President conducted a total of 1,164 general-election campaign events in the four elections between 2008 and 2020.
In table 9.1, the first four columns show the number of general-election campaign events in those four elections that took place in the eight states with three electoral votes.[222], [223] The last four columns of the table show the Republican percentage of the two-party vote in each election. The table is sorted according to the Republican nominee’s percentage in 2020.
Table 9.1 Presidential campaigns in the eight states with three electoral votes 2008–2020
| 2020 events | 2016 events | 2012 events | 2008 events | State | 2020 R-% | 2016 R-% | 2012 R-% | 2008 R-% |
| Wyoming | 72% | 76% | 71% | 67% | ||||
| North Dakota | 67% | 70% | 60% | 54% | ||||
| South Dakota | 63% | 66% | 59% | 54% | ||||
| Montana | 58% | 61% | 57% | 51% | ||||
| Alaska | 55% | 58% | 57% | 61% | ||||
| Delaware | 40% | 44% | 41% | 37% | ||||
| Vermont | 32% | 35% | 32% | 31% | ||||
| 1 | D.C. | 6% | 4% | 7% | 7% | |||
| 0 | 0 | 0 | 1 | Total |
The table shows that there was only one general-election campaign event conducted in the eight smallest states between 2008 and 2020. It was in the District of Columbia in 2008.
The table also shows why both Republican and Democratic presidential candidates almost totally ignored the eight smallest states.
All eight of the smallest states are one-party states in presidential elections. The outcome in each was a foregone conclusion long before Election Day. The two-party vote in these states was not within the narrow range that gives a candidate any chance to change the outcome.
Comparison of the eight smallest states with the battleground state of Wisconsin
Wisconsin’s population (5,698,230) is about the same as the combined population of the eight smallest states (5,912,842).[224]
Because of the two senatorial electoral votes that every state receives, the eight smallest states have a whopping 24 electoral votes—compared to only 10 for Wisconsin.
According to the defenders of the current system, the disproportionately large number of electoral votes possessed by the small states gives them increased clout.
However, Wisconsin received a total of 58 general-election campaign events between 2008 and 2020, compared to only one visit for the eight smallest states combined.
Wisconsin received 6% of the nation’s 1,164 campaign events during the four elections—even though the state has 2% of the nation’s population. That is, it got three times more attention than warranted by its population.
In contrast, the eight smallest states received only 0.1% of the 1,164 campaign events during this period—even though these states have 2% of the nation’s population. That is, the smallest states received one-twentieth of the attention that their population warrants.
Figure 9.1 shows that Wisconsin received considerably more attention than the eight smallest states, even though the eight states have considerably more electoral votes.
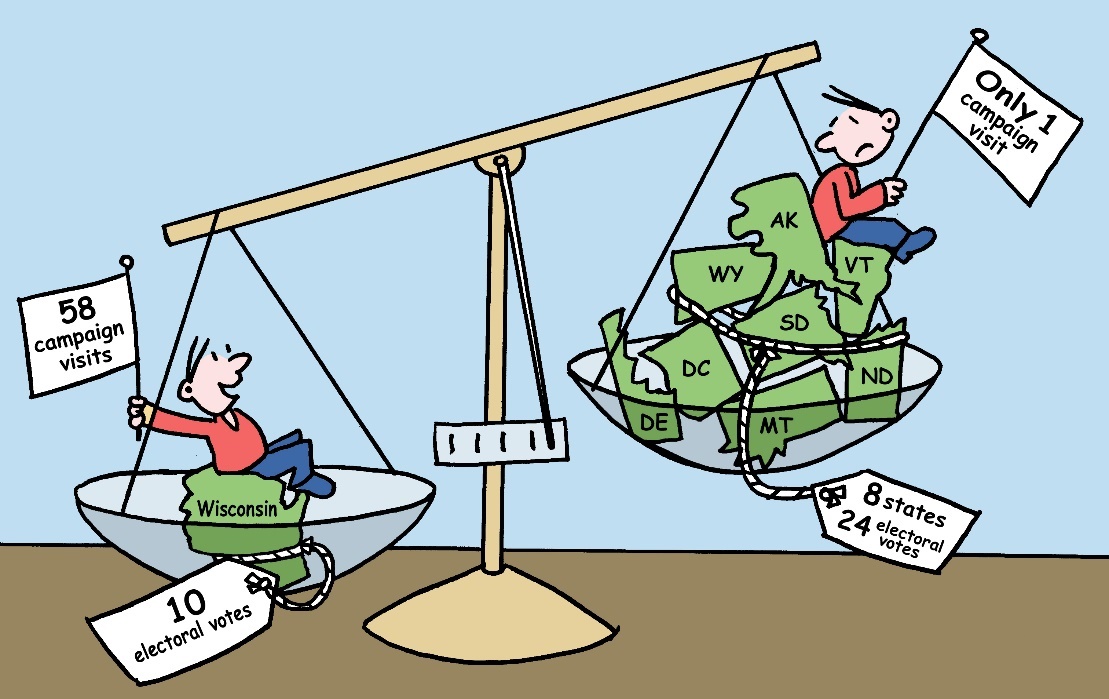
Mike Flanagan—flantoons@btinternet.com
The current state-by-state winner-take-all method of awarding electoral votes is the reason why the 5.6 million people in Wisconsin received so much attention, and why the equivalent number of people in the eight smallest states received virtually no attention.
A thought experiment involving the eight smallest states
Now suppose the 5.9 million voters of the eight smallest states were not politically isolated inside the boundaries of their respective states but that they lived in a single state.
Given that this imaginary combined state has essentially the same population as Wisconsin, it would have only 10 electoral votes—considerably fewer than the 24 actually possessed by the eight separate states today.
The two-party vote in this imaginary combined state was closely divided in all four presidential elections between 2008 and 2020:
- 51%–49% for Biden in 2020
- 52%–48% for Trump in 2016
- 52%–48% for Obama in 2012
- 54%–46% for Obama in 2008
That is, this imaginary combined state would be equivalent to Wisconsin in terms of
- population
- number of electoral votes
- competitiveness.
Thus, the voters of this imaginary combined state would be as important in presidential politics as Wisconsin. They would therefore receive essentially the same amount of attention from presidential candidates as Wisconsin currently does.
Presidential candidates would become familiar with the issues of concern to the voters of this imaginary combined state, fashion their platforms to appeal to these voters, communicate their platforms to these voters through advertising, and do all the other things that candidates do to solicit votes (e.g., open offices, run a ground game, encourage grassroots participation).
The same thing would happen under a national popular vote for President. Every voter in this imaginary combined state would suddenly matter to both the Democratic and Republican nominee. A vote in this imaginary combined state would become as valuable as a vote anywhere else in the country.
In short, a national popular vote for President would eliminate the artificial Balkanization of small-state voters and make them politically relevant in presidential elections.
The 13 states with three or four electoral votes
A similar pattern emerges if we expand the definition of a small state to include the 13 states with three or four electoral votes.
Table 9.2 shows the number of general-election campaign events and the Republican percentage of the two-party vote between 2008 and 2020 in the 13 smallest states.
Table 9.2 Presidential campaigns in the 13 states with three or four electoral votes 2008–2020
| 2020 events | 2016 events | 2012 events | 2008 events | State | 2020 R-% | 2016 R-% | 2012 R-% | 2008 R-% | EV |
| Wyoming | 72% | 76% | 71% | 67% | 3 | ||||
| North Dakota | 67% | 70% | 60% | 54% | 3 | ||||
| Idaho | 66% | 68% | 66% | 63% | 4 | ||||
| South Dakota | 63% | 66% | 59% | 54% | 3 | ||||
| Montana | 58% | 61% | 57% | 51% | 3 | ||||
| Alaska | 55% | 58% | 57% | 61% | 3 | ||||
| 4 | 21 | 13 | 12 | New Hampshire | 46% | 49.8% | 47% | 45% | 4 |
| 2 | 3 | 2 | Maine | 45% | 48% | 42% | 41% | 4 | |
| Delaware | 40% | 44% | 41% | 37% | 3 | ||||
| Rhode Island | 39% | 42% | 36% | 36% | 4 | ||||
| Hawaii | 35% | 33% | 28% | 27% | 4 | ||||
| Vermont | 32% | 35% | 32% | 31% | 3 | ||||
| 1 | D.C. | 6% | 4% | 7% | 7% | 3 | |||
| 6 | 24 | 13 | 15 | Total | 44 |
New Hampshire stands out in this table in terms of the amount of attention that it received in these general-election campaigns. It received almost all (50 of the 58) of the campaign events received by this entire group of states.
New Hampshire’s 50 general-election campaign events were 4% of the nationwide total of 1,164 events—far in excess of the number warranted by the state’s population.
The reason why presidential candidates campaigned vigorously in New Hampshire—while ignoring equally populous states such as Idaho, Rhode Island, and Hawaii and all the other small states—is that its statewide popular vote was closely divided in New Hampshire, whereas the other small states were non-competitive one-party states.[225]
Note that Maine is the only other small state in table 9.2 that received any significant amount of attention among the 13 smallest states.
The reason is that Maine awards two of its electoral votes by congressional district. Its 2nd district (the northern part of the state) was closely divided in three of the four elections (2008, 2016, and 2020).
Presidential candidates campaigned in Maine because they perceived (correctly) that one electoral vote was up for grabs in the northern part of the state. In fact, Donald Trump carried the 2nd district in 2016 and 2020. Meanwhile, the Democratic presidential nominee carried the state as a whole in all four elections because of the heavily Democratic 1st district (centered in Portland). In other words, the state of Maine was not politically competitive, but the 2nd district was.
Table 9.2 also shows that the six states at the top of the table are heavily Republican and did not receive any campaign events in any of the four elections. The Republican presidential nominees (wisely) decided that they could take these states for granted and still win all of their electoral votes.[226] The Democratic nominees (equally wisely) wrote off these solidly red states, because they had no realistic possibility of winning any electoral votes there.
Similarly, five of the states at the bottom of table 9.2 are so heavily Democratic that the Democratic nominees knew that they were in the bag. Meanwhile, the Republican nominees knew that those states were hopelessly out of reach.[227]
A thought experiment involving the 12 smallest non-battleground states
Now let’s return to the claim that small states have increased clout because of the two senatorial electoral votes that every state receives.
The 12 non-battleground small states in table 9.2 (that is, the 13 smallest states except New Hampshire) have a combined population of 11,241,524.
Coincidentally, Ohio has almost the same number of people (11,568,495).
Because of the two senatorial electoral votes that every state receives above the number warranted by its population, the 12 non-battleground small states have 40 electoral votes, whereas Ohio has only about half as many.[228]
Despite having only about half as many electoral votes as the 12 non-battleground small states, Ohio received a total of 196 general-election campaign events in the four elections (out of a total of 1,164 events nationwide). Meanwhile, the 12 non-battleground small states received just eight events out of 1,164. Moreover, seven of those eight events were in Maine in years when the state's northern congressional district was competitive.
The current state-by-state winner-take-all method of awarding electoral votes is the reason why the 11.5 million people in Ohio received so much attention, and why the 11.2 million people in the 12 non-battleground small states received so little attention. Under the current system, political clout does not arise from the number of electoral votes that a state possesses, but from whether the state is closely divided.
If the 11.2 million people in the 12 noncompetitive small states had lived in a single state, that imaginary combined state would have been a closely divided battleground state. Its two-party vote would have been:
- 51%–49% for Biden in 2020
- 51%–49% for Trump in 2016
- 53%–47% for Obama in 2012
- 55%–45% for Obama in 2008.
This imaginary combined state would have essentially the same population as Ohio. However, it would have only 20 electoral votes[229]—not the 40 electoral votes actually possessed by the 12 separate small states.
In other words, the voters of this imaginary combined state would have almost the same population, number of electoral votes, and political complexion as Ohio.
Thus, it would become as important in presidential politics as Ohio’s voters, and presidential campaigns would necessarily give the imaginary combined state more or less as much attention as Ohio.
As former Congressman and presidential candidate Tom Tancredo (R–Colorado) wrote in 2012:
“Some argue that the present system protects the interests of small states, especially those that hold conservative values. However, today 12 of the 13 smallest states are ignored after party conventions and are derisively referred to as ‘flyover’ country.”
“Under the [National Popular Vote] plan, an evangelical voter in rural Wyoming would count the same as the union steward in Cleveland.”[230] [Emphasis added]
The 25 smallest states (three to seven electoral votes)
Let’s now generously expand the definition of a small state to include the 25 states with three to seven electoral votes.
Table 9.3 shows the number of general-election campaign events and the Republican percentage of the two-party vote between 2008 and 2020 in the 25 smallest states. These states have a combined population of 46,819,264.
Table 9.3 Presidential campaigns in the 25 states with three to seven electoral votes 2008–2020
| 2020 events | 2016 events | 2012 events | 2008 events | State | 2020 R-% | 2016 R-% | 2012 R-% | 2008 R-% | EV |
| Wyoming | 72% | 76% | 71% | 67% | 3 | ||||
| 1 | West Virginia | 70% | 72% | 64% | 57% | 5 | |||
| North Dakota | 67% | 70% | 60% | 54% | 3 | ||||
| Oklahoma | 67% | 69% | 67% | 66% | 7 | ||||
| Idaho | 66% | 68% | 66% | 63% | 4 | ||||
| Arkansas | 64% | 64% | 62% | 60% | 6 | ||||
| South Dakota | 63% | 66% | 59% | 54% | 3 | ||||
| 1 | Utah | 61% | 62% | 75% | 65% | 6 | |||
| 1 | 2 | Nebraska | 60% | 64% | 61% | 58% | 5 | ||
| Montana | 58% | 61% | 57% | 51% | 3 | ||||
| 1 | Mississippi | 58% | 59% | 56% | 57% | 6 | |||
| Kansas | 57% | 61% | 61% | 58% | 6 | ||||
| Alaska | 55% | 58% | 57% | 61% | 3 | ||||
| 5 | 21 | 27 | 7 | Iowa | 54% | 55% | 47% | 45% | 6 |
| 11 | 17 | 13 | 12 | Nevada | 49% | 49% | 47% | 44% | 6 |
| 4 | 21 | 13 | 12 | New Hampshire | 46% | 49.8% | 47% | 45% | 4 |
| 2 | 3 | 2 | Maine | 45% | 48% | 42% | 41% | 4 | |
| 3 | 8 | New Mexico | 44% | 45% | 45% | 42% | 5 | ||
| Oregon | 42% | 44% | 44% | 42% | 7 | ||||
| Delaware | 40% | 44% | 41% | 37% | 3 | ||||
| 1 | Connecticut | 40% | 43% | 41% | 39% | 7 | |||
| Rhode Island | 39% | 42% | 36% | 36% | 4 | ||||
| Hawaii | 35% | 33% | 28% | 27% | 4 | ||||
| Vermont | 32% | 35% | 32% | 31% | 3 | ||||
| 1 | D.C. | 6% | 4% | 7% | 7% | 3 | |||
| 23 | 70 | 53 | 43 | Total | 189 |
As can be seen in the table, only three of the 25 states (New Hampshire, Nevada, and Iowa) received any significant amount of attention over the course of the four elections. They accounted for almost all (163 out of 189) of the campaign events received by this entire group of states. Fifteen of these smallest states received no attention at all during any of the four elections.
The reason why so much attention was lavished on these particular three states becomes apparent by looking at the level of support in each state for each candidate.
New Hampshire, Nevada, and Iowa received almost all of the attention, because they were closely divided.
In addition, Maine and Nebraska received a modest number of events, because one congressional district in each state was competitive. New Mexico was competitive in 2008 and received a considerable amount of attention at the time. However, it has not been a battleground state in presidential elections since then.
In a 1979 Senate speech, U.S. Senator Henry Bellmon (R–Oklahoma) described how his views on the Electoral College had changed as a result of serving as national campaign director for Richard Nixon and a member of the American Bar Association’s commission studying electoral reform:
“While the consideration of the electoral college began—and I am a little embarrassed to admit this—I was convinced, as are many residents of smaller States, that the present system is a considerable advantage to less-populous States such as Oklahoma. … As the deliberations of the American Bar Association Commission proceeded and as more facts became known, I came to the realization that the present electoral system does not give an advantage to the voters from the less-populous States. Rather, it works to the disadvantage of small State voters who are largely ignored in the general election for President.”[231] [Emphasis added]
Senator Robert E. Dole of Kansas, the Republican nominee for President in 1996 and Republican nominee for Vice President in 1976, stated in a 1979 floor speech:
“Many persons have the impression that the Electoral College benefits those persons living in small states. I feel that this is somewhat of a misconception. Through my experience with the Republican National Committee and as a vice-presidential candidate in 1976, it became very clear that the populous states with their large blocks of electoral votes were the crucial states. It was in these states that we focused our efforts.
“Were we to switch to a system of direct election, I think we would see a resulting change in the nature of campaigning. While urban areas will still be important campaigning centers, there will be a new emphasis given to smaller states. Candidates will soon realize that all votes are important, and votes from small states carry the same import as votes from large states. That to me is one of the major attractions of direct election. Each vote carries equal importance.
“Direct election would give candidates incentive to campaign in States that are perceived to be single party states.”[232] [Emphasis added]
The political clout of the small states is not based on the Electoral College.
In discussing the political clout of small states, it is well to remember that the Electoral College is not the bulwark of influence for the small states in the U.S. Constitution.
The small states’ source of political clout is the equal representation of the states in the U.S. Senate (and, to a lesser extent, the equal representation of the states in the constitutional amendment process and, to an even lesser extent, the equal representation of the states in contingent elections for President in the U.S. House).
The 13 smallest states (with 3% of the nation’s population) have 25% of the votes in the U.S. Senate—an enormously significant source of political clout in fashioning federal legislation (as well as in the confirmation and treaty-making processes).
Footnotes
[212] Freedom Foundation. 2010. Brochure. Olympia, Washington.
[213] Debate at the Larimer County, Colorado, League of Women Voters on June 28, 2012, with Robert Hardaway of the University of Denver Sturm College of Law, Professor Robert Hoffert of Colorado State University, Elena Nunez of Colorado Common Cause, and Patrick Rosenstiel of Ainsley-Shea. Timestamp 18:00. http://www.youtube.com/watch?v=U_yCSqgm_dY
[214] McConnell, Mitch. The Electoral College and National Popular Vote Plan. Heritage Foundation Lecture. December 7, 2011. Washington, DC. Timestamp 19:36.
[215] Williams, Walter E. 2018. The Electoral College debate. Atlanta Constitution. October 15, 2018. https://www.myajc.com/news/opinion/opinion-the-electoral-college-debate/TiHmvVp3lCteA0icMwCQEP
[216] Ross, Tara. 2012. Enlightened Democracy: The Case for the Electoral College. Los Angeles, CA: World Ahead Publishing Company. Second edition.
[217] Ross, Tara. 2017. The Indispensable Electoral College: How the Founders’ Plan Saves Our Control from Mob Rule. Washington, DC: Regnery Gateway.
[218] Ross, Tara; Cooper, Kate E.; and Ross, Emma. 2016. We Elect a President: The Story of Our Electoral College. Dallas, TX: Colonial Press L.P.
[219] Ross, Tara. 2011. Testimony for Delaware Senate on the National Popular Vote Bill (HB 198). June 21, 2010. Ross made identical statements at the Nevada Senate Committee on Legislative Operations and Elections on May 7, 2009.
[220] Gregg, Gary L, II. (editor). 2001. Securing Democracy: Why We Have an Electoral College. Wilmington, DE: ISI Books.
[221] Gregg, Gary. Keep Electoral College for fair presidential votes. Politico. December 5, 2012.
[222] The District of Columbia received three electoral votes under the 23rd Amendment (ratified in 1961). For convenience, we frequently refer to the District of Columbia as a “state” in this book.
[223] The number of electoral votes presented in this table (and similar tables later in this section) are for the 2012, 2016, and 2020 elections. The (slightly different) number of electoral votes for the 2008 election may be found in table 3.1.
[224] The 2010 census is used throughout this section.
[225] Note that there were 21 general-election campaign events in New Hampshire in 2016 when the race was extremely close (49.8% to 50.2%), but only four events in 2020 (when there was an eight percentage-point spread between Biden and Trump). That is, the degree of closeness determines the amount of attention that a state receives. See section 9.1.6 for a discussion of the “3/2 rule.”
[226] The partisan orientation of these six red states has been the same for a considerable period of time. The Republican nominee carried all of them in all eight presidential elections between 1992 and 2020, except in 1992, when Ross Perot’s candidacy enabled Bill Clinton to eke out a plurality in Montana.
[227] The partisan orientation of these six blue states has been the same for a considerable period of time. The Democratic nominees carried all six of them in all eight presidential elections between 1992 and 2020.
[228] Ohio had 20 electoral votes in 2008, and 18 after the 2010 census.
[229] The imaginary state would have the same 18 electoral votes as Ohio, plus two senatorial electoral votes.
[230] Tancredo, Tom. Should every vote count? WND. November 11, 2011. http://www.wnd.com/index.php?pageId=366929
[231] Congressional Record. July 10, 1979. Page 17748. https://www.congress.gov/bound-congressional-record/1979/07/10/senate-section
[232] Congressional Record. January 15, 1979. Page 309. https://www.congress.gov/bound-congressional-record/1979/01/15/senate-section
9.3.2 MYTH: The small states give the Republican Party a systemic advantage in the Electoral College.
QUICK ANSWER:
- Contrary to political mythology, the Republican Party gains no partisan advantage from the 13 smallest states (i.e., those with three or four electoral votes) under the current state-by-state winner-take-all system. Whether measured by number of states, number of electoral votes, or number of popular votes, the smallest states are almost equally divided politically in presidential elections. In fact, there is a slight tilt in favor of the Democrats as measured by all three yardsticks.
- All but one of the smallest states are non-competitive one-party states in presidential elections. The one closely divided small state (New Hampshire) went Democratic in seven of the eight presidential elections between 1992 and 2020.
One of the most frequently repeated statements about presidential elections is the inaccurate claim that the small states give the Republican Party a systemic advantage in the Electoral College.
There were 13 states with three or four electoral votes after the 1990, 2000, and 2010 census.
We examine these states in terms of three yardsticks:
- number of states won by each party,
- number of electoral votes won by each party, and
- number of popular votes won by each party.
Number of small states won by each party between 1992 and 2020
The smallest states have been almost equally divided politically in the eight presidential elections between 1992 and 2020 (with a slight edge to the Democrats).
The Republican presidential nominee almost always carried six small states between 1992 and 2020—Alaska, Idaho, Montana, North Dakota, South Dakota, and Wyoming.
Montana is the only one of these states that did not vote Republican in all eight elections. It went for Bill Clinton in 1992 when independent candidate Ross Perot divided the state’s popular vote.
The Democratic presidential nominee carried seven small states between 1992 and 2020—Delaware, the District of Columbia, Hawaii, Maine, New Hampshire, Rhode Island, and Vermont.
New Hampshire is the only one of these states that did not vote Democratic in all eight elections. It went for George H.W. Bush in 2000 when third-party candidate Ralph Nader divided the vote.
Table 9.4 shows which party carried each of the 13 smallest states in the eight presidential elections between 1992 and 2020.[233]
Table 9.4 Presidential voting by the 13 smallest states 1992–2020
| State | 1992 | 1996 | 2000 | 2004 | 2008 | 2012 | 2016 | 2020 |
| Delaware | D | D | D | D | D | D | D | D |
| D.C. | D | D | D | D | D | D | D | D |
| Hawaii | D | D | D | D | D | D | D | D |
| Maine | D | D | D | D | D | D | D | D |
| Rhode Island | D | D | D | D | D | D | D | D |
| Vermont | D | D | D | D | D | D | D | D |
| New Hampshire | D | D | R | D | D | D | D | D |
| Montana | D | R | R | R | R | R | R | R |
| Alaska | R | R | R | R | R | R | R | R |
| Idaho | R | R | R | R | R | R | R | R |
| North Dakota | R | R | R | R | R | R | R | R |
| South Dakota | R | R | R | R | R | R | R | R |
| Wyoming | R | R | R | R | R | R | R | R |
| Democratic states | 8 | 7 | 6 | 7 | 7 | 7 | 7 | 7 |
| Republican states | 5 | 6 | 7 | 6 | 6 | 6 | 6 | 6 |
| Democratic EV | 27 | 24 | 20 | 24 | 24 | 24 | 23 | 23 |
| Republican EV | 17 | 20 | 24 | 20 | 20 | 20 | 21 | 21 |
Overall, the Democratic presidential nominee won the smallest states 56 times, while the Republican won them 48 times in the eight presidential elections between 1992 and 2020.
The Democratic presidential nominee won the 13 smallest states by a 7–6 margin in six of the eight elections.
The Democratic nominee won these states by an 8–5 margin in 1992, and the Republican nominee won these states by a 7–6 margin in 2000.
Number of electoral votes won by each party between 1992 and 2020
Table 9.4 also shows that the Democrats won more electoral votes than the Republicans from the smallest states in seven of the eight presidential elections between 1992 and 2020.
Overall, the Democratic presidential nominee won 189 electoral votes from the 13 smallest states, while the Republican won 163 electoral votes.
Number of popular votes won by each party between 2000 and 2020
The popular vote in the 13 smallest states has been almost equally divided in the six presidential elections between 2000 and 2020.[234]
Overall, the Democratic presidential nominee won 16,951,920 popular votes (51%) from the 13 smallest states in the six presidential elections between 2000 and 2020, while the Republican won 16,298,161 popular votes (49%), as shown in table 9.5.
Table 9.5 The popular vote in the 13 smallest states was divided 51%–49% in favor of the Democratic presidential nominee in the six presidential elections between 2000 and 2020.
| Year | Republican popular votes | Democratic popular votes |
| 2000 | 2,361,723 | 2,171,442 |
| 2004 | 2,801,822 | 2,612,915 |
| 2008 | 2,544,113 | 3,137,100 |
| 2012 | 2,603,226 | 2,942,513 |
| 2016 | 2,754,608 | 2,673,800 |
| 2020 | 3,232,669 | 3,414,150 |
| Total | 16,298,161 | 16,951,920 |
| Two-party percentage | 49.0% | 51.0% |
In terms of percentages, the two-party popular vote in the 13 smallest states between 2000 and 2020:
- favored Biden 51.4% to 48.6% in 2020
- favored Trump 50.7% to 49.3% in 2016
- favored Obama 53.1% to 46.9% in 2012
- favored Obama 55.2% to 44.8% in 2008
- favored George W. Bush 51.7% to 48.3% in 2004
- favored George W. Bush 52.1% to 47.9% in 2000.
Fourteen states have three or four electoral votes in 2024 and 2028.
West Virginia lost one congressional district as a result of the 2020 census and will therefore have only four electoral votes in 2024 and 2028.
Montana gained one congressional district and will have four electoral votes.
Both states are safely Republican in presidential elections and therefore received no general-election campaign events in the four presidential elections between 2008 and 2020.
New Hampshire continues to be the only one of the 14 smallest states that is likely to be competitive in 2024.
Figure 9.2 shows that the 14 states with three or four electoral votes in the 2024 and 2028 presidential elections were equally divided in the four presidential elections between 2004 and 2020.
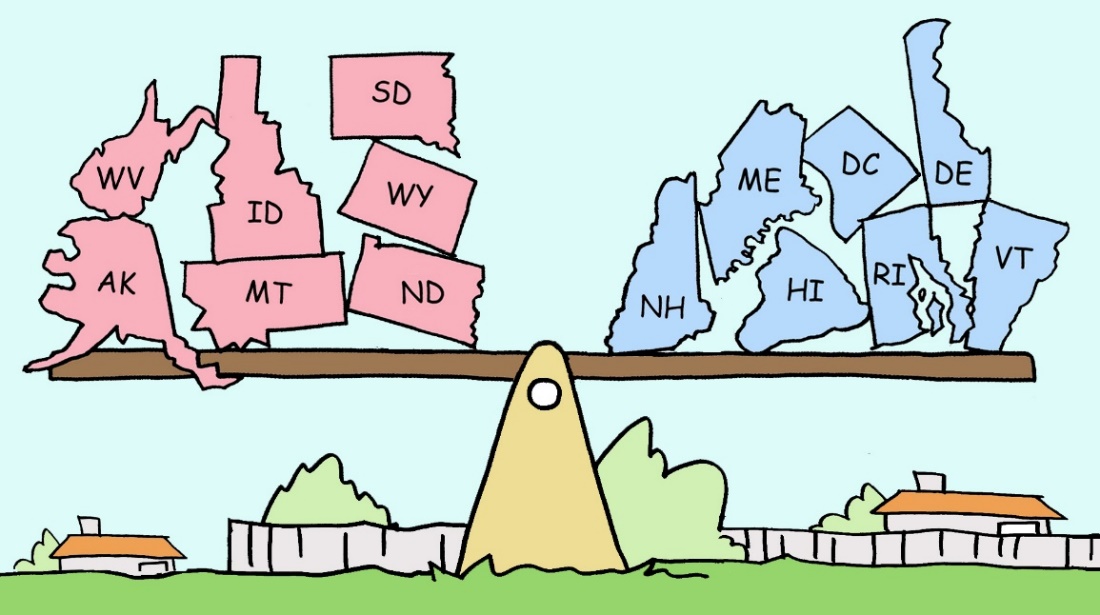
Mike Flanagan—flantoons@btinternet.com
Possible origin of the myth that the small states are Republican in presidential elections
The origin of this myth may be the fact that the 12 smallest states divided 9–3 in favor of the Republicans in the relatively close presidential elections of 1960, 1968, and 1976 as well as the fact that there were Republican landslides in the Electoral College in four other elections during this period (1972, 1980, 1984, 1988).
The 13 smallest states cast 3% of the nation’s popular vote while possessing 6% of the electoral votes. That is, the 13 smallest states have 26 electoral votes above what their population would warrant.
Even if these 26 electoral votes unanimously favored the Republican Party (and this is manifestly not the case), 26 electoral votes out of 538 would not create a controlling advantage.
Biden won in 2020 by a 306–232 margin in the Electoral College. Trump won in 2016 with an identical margin. Obama won in 2012 by a 332–206 margin, and he won in 2008 by a 365–173 margin.
Footnotes
[233] The table shows which party’s presidential candidate won statewide. Maine awards two of its four electoral votes by congressional district. In 2016 and 2020, Donald Trump won one of Maine’s district-level electoral votes by carrying the state’s 2nd congressional district, while the Democratic nominee won three electoral votes (representing the state as a whole and the 1st district).
[234] Ross Perot received 19% of the national popular vote in 1992 and 8% in 1996.
9.3.3 MYTH: Thirty-one states would lose power under a national popular vote.
QUICK ANSWER:
- The claim that 31 states would lose power under a national popular vote is based on an arithmetic calculation that bears no relation to what happens in real-world presidential campaigns.
- The claim is based on the ratio of each state’s percentage share of the nation’s voters to the state’s percentage share of the entire country’s 538 electoral votes. This ratio creates the impression that the 31 smallest states have enhanced clout in presidential elections under the current system. However, the actual behavior of real-world presidential candidates indicates that political clout comes from being a closely divided state. Presidential candidates concentrate virtually all of their general-election campaigning in battleground states. Because almost all smaller states are one-party states in presidential races, they are politically irrelevant in general-election campaigns for President.
In a 2011 article entitled “National Popular Vote Plan Would Hurt Most States,” Morton C. Blackwell, a long-standing member of the Republican National Committee from Virginia, wrote:
“Thirty-one states would lose power in presidential elections under [the National Popular Vote] plan.”
“If NPV had been in effect in 2008, Delaware would have lost 44% of its power. Rhode Island would have lost 51.49% of its power. Wyoming’s power would have dropped by 65.48%. The pattern is the same for all the smaller-population states.”[235]
Blackwell based this statement upon an arithmetic calculation that compares each state’s percentage share of the nation’s voters in 2008 to the state’s percentage share of the entire country’s 538 electoral votes.
Table 9.6 shows Blackwell’s calculation.
- Column 2 is the state’s number of electoral votes.
- Column 3 is the state’s percentage share of the entire country’s 538 electoral votes. For example, Wyoming’s three electoral votes represent 0.56% of the entire country’s 538 electoral votes.
- Column 4 is the number of popular votes cast in the state in the 2008 presidential election.
- Column 5 is the state’s percentage share of the entire country’s 132,454,039 popular votes for President in 2008.[236] For example, Wyoming’s 256,035 popular votes for President constituted 0.19% of the nationwide total.
- Column 6 is the difference between column 5 and column 3. For example, the difference between 0.19% and 0.56% is –0.37% for Wyoming. That is, Wyoming’s percentage share of the nation’s voters in 2008 is less than its percentage share of the entire country’s 538 electoral votes.
- Column 7 is the ratio of column 6 to column 3. For example, the –0.37% difference for Wyoming in column 6 is –65.48% of 0.56%. Blackwell then interprets this negative number as demonstrating that Wyoming would lose 65.48% of its power in presidential elections.
Table 9.6 Morton Blackwell’s calculations
| State | EV | % of 538 | Popular votes | % of popular vote | % difference in power | Change due to NPV |
| Alabama | 9 | 1.67% | 2,105,622 | 1.59% | -0.08% | -4.97% |
| Alaska | 3 | 0.56% | 327,341 | 0.25% | -0.31% | -55.68% |
| Arizona | 10 | 1.86% | 2,320,851 | 1.75% | -0.11% | -5.73% |
| Arkansas | 6 | 1.12% | 1,095,958 | 0.83% | -0.29% | -25.81% |
| California | 55 | 10.22% | 13,743,177 | 10.38% | 0.15% | 1.49% |
| Colorado | 9 | 1.67% | 2,422,236 | 1.83% | 0.16% | 9.32% |
| Connecticut | 7 | 1.30% | 1,644,845 | 1.24% | -0.06% | -4.56% |
| Delaware | 3 | 0.56% | 413,562 | 0.31% | -0.25% | -44.01% |
| D.C. | 3 | 0.56% | 266,871 | 0.20% | -0.36% | -64.02% |
| Florida | 27 | 5.02% | 8,453,743 | 6.38% | 1.36% | 27.18% |
| Georgia | 15 | 2.79% | 3,940,705 | 2.98% | 0.19% | 6.71% |
| Hawaii | 4 | 0.74% | 456,064 | 0.34% | -0.40% | -53.69% |
| Idaho | 4 | 0.74% | 667,506 | 0.50% | -0.24% | -31.90% |
| Illinois | 21 | 3.90% | 5,578,195 | 4.21% | 0.31% | 7.89% |
| Indiana | 11 | 2.04% | 2,805,986 | 2.12% | 0.07% | 3.61% |
| Iowa | 7 | 1.30% | 1,543,662 | 1.17% | -0.13% | -10.35% |
| Kansas | 6 | 1.12% | 1,264,208 | 0.95% | -0.17% | -14.78% |
| Kentucky | 8 | 1.49% | 1,858,578 | 1.40% | -0.08% | -5.64% |
| Louisiana | 9 | 1.67% | 1,979,852 | 1.49% | -0.18% | -10.49% |
| Maine | 4 | 0.74% | 744,456 | 0.56% | -0.18% | -24.05% |
| Maryland | 10 | 1.86% | 2,651,428 | 2.00% | 0.14% | 7.62% |
| Massachusetts | 12 | 2.23% | 3,102,995 | 2.34% | 0.11% | 5.03% |
| Michigan | 17 | 3.16% | 5,039,080 | 3.80% | 0.64% | 20.40% |
| Minnesota | 10 | 1.86% | 2,921,147 | 2.21% | 0.35% | 18.57% |
| Mississippi | 6 | 1.12% | 1,289,939 | 0.97% | -0.15% | -13.05% |
| Missouri | 11 | 2.04% | 2,992,023 | 2.26% | 0.21% | 10.48% |
| Montana | 3 | 0.56% | 497,599 | 0.38% | -0.18% | -32.91% |
| Nebraska | 5 | 0.93% | 811,923 | 0.61% | -0.32% | -34.04% |
| Nevada | 5 | 0.93% | 970,019 | 0.73% | -0.20% | -21.25% |
| New Hampshire | 4 | 0.74% | 719,643 | 0.54% | -0.20% | -26.58% |
| New Jersey | 15 | 2.79% | 3,910,220 | 2.95% | 0.16% | 5.88% |
| New Mexico | 5 | 0.93% | 833,365 | 0.63% | -0.30% | -32.35% |
| New York | 31 | 5.76% | 7,721,718 | 5.83% | 0.07% | 1.17% |
| North Carolina | 15 | 2.79% | 4,354,571 | 3.29% | 0.50% | 17.92% |
| North Dakota | 3 | 0.56% | 321,133 | 0.24% | -0.32% | -56.71% |
| Ohio | 20 | 3.72% | 5,773,387 | 4.36% | 0.64% | 17.25% |
| Oklahoma | 7 | 1.30% | 1,474,694 | 1.11% | -0.19% | -14.36% |
| Oregon | 7 | 1.30% | 1,845,251 | 1.39% | 0.09% | 7.16% |
| Pennsylvania | 21 | 3.90% | 5,996,229 | 4.53% | 0.62% | 15.98% |
| Rhode Island | 4 | 0.74% | 475,428 | 0.36% | -0.38% | -51.49% |
| South Carolina | 8 | 1.49% | 1,927,153 | 1.45% | -0.04% | -2.35% |
| South Dakota | 3 | 0.56% | 387,449 | 0.29% | -0.27% | -47.77% |
| Tennessee | 11 | 2.04% | 2,618,238 | 1.98% | -0.06% | -3.10% |
| Texas | 34 | 6.32% | 8,078,524 | 6.10% | -0.22% | -3.49% |
| Utah | 5 | 0.93% | 971,185 | 0.73% | -0.20% | -21.16% |
| Vermont | 3 | 0.56% | 326,822 | 0.25% | -0.31% | -55.94% |
| Virginia | 13 | 2.42% | 3,753,059 | 2.83% | 0.42% | 17.26% |
| Washington | 11 | 2.04% | 3,071,587 | 2.32% | 0.28% | 13.68% |
| West Virginia | 5 | 0.93% | 731,691 | 0.55% | -0.38% | -40.60% |
| Wisconsin | 10 | 1.86% | 2,997,086 | 2.26% | 0.40% | 21.65% |
| Wyoming | 3 | 0.56% | 256,035 | 0.19% | -0.37% | -65.48% |
| Total | 538 | 100.00% | 132,454,039 | 100.00% |
Blackwell’s arithmetic is correct. However, this arithmetic bears no relation to what happens in real-world presidential campaigns.
Presidential candidates concentrate virtually all of their general-election campaigning in closely divided states.
Because almost all small states are one-party states in presidential races, they are politically irrelevant in the general election campaign for President.
Political clout comes from being a battleground state—not from the ratio of electoral votes to the number of voters (as discussed in detail in section 9.1).
An examination of table 9.2 shows that 11 of the 13 smallest states (those with three or four electoral votes) received no attention at all in the 2008 campaign. The only significant amount of campaigning was in New Hampshire—the sole closely divided state among the 13 smallest states.
Note that the tendency of small-population states to be one-party states in presidential election extends to the 31 smallest states, as shown in table 1.15 and figure 1.12. In fact, 22 of the 31 smallest states were totally ignored under the current state-by-state winner-take-all method of awarding electoral votes.
Yet, Blackwell would have us believe that the current system confers enhanced political clout on these 31 smallest states.
A closer examination of Blackwell’s calculation shows that it simply demonstrates a geographical and historical oddity concerning the peculiar distribution of state sizes in the United States, namely that about two-thirds of states happen to have a below-average number of electoral votes.
The average number of electoral votes per state is 10.55 (that is, 538 divided by 51).
The fact is that two-thirds of the states have a below-average number of electoral votes—that is, 33 states have 10 or fewer electoral votes.
Because each state receives two electoral votes (above and beyond what would be warranted by its population), the percentage share of the nation’s 538 electoral votes for each of the 33 below-average-sized states is larger than the state’s percentage share of the nation’s population.[237]
In short, Blackwell’s calculation is just a reflection of the particular geographical distribution of the U.S. population among the states.
Footnotes
[235] Blackwell, Morton C. National Popular Vote plan would hurt most states. The Western Journal. June 25, 2011. Blackwell’s 2011 memo and calculations for each state may be found at https://www.leadershipinstitute.org/img/email/nationalpopularvote.pdf. The Unleash Prosperity Hotline. Newsletter 3838 (August 18, 2023) of the Committee to Unleash Prosperity discussed Blackwell’s memo in its edition under the heading “National Popular Vote Would Screw the Small States.”
[236] Blackwell’s vote counts differ slightly from those found in Leip’s Election Almanac (131,461,581) by about 8,000 votes nationwide. Blackwell’s article does not state the source of his vote counts. However, this tiny nationwide discrepancy does not affect Blackwell’s argument.
[237] If there were no differences in voter turnout among states, and no changes in population since the immediately preceding census (eight years earlier in the case of Blackwell’s article), a state’s percentage share of the 538 electoral votes would be larger for all 33 of the smallest states. Because there are differences in voter turnout from state to state as well as some intra-decade population changes, Blackwell’s calculation ends up showing that a state’s percentage share of the 538 electoral votes is larger for 31 of the 33 smallest states.
9.3.4 MYTH: The small states are so small that they will not attract any attention under any system.
QUICK ANSWER:
- Presidential candidates are not averse to campaigning in small states. In fact, they have lavished a considerable amount of attention on the one small state (New Hampshire with four electoral votes) that has been closely divided in recent general elections for President. Moreover, they have also frequently campaigned in Maine trying to win one electoral vote from the state’s competitive 2nd congressional district.
- The other small states (those with three or four electoral votes) are not ignored because they are small, but because they are one-party states in presidential elections.
- Serious candidates for office solicit every vote that could possibly decide whether they win. Every vote in every state would matter in every presidential election in a nationwide vote for President. Under a national popular vote, a voter in a small state would become as important as any other voter in the United States. Moreover, in most cases, small states offer presidential candidates the attraction of considerably lower per-impression media costs.
Because New Hampshire was a closely divided state in the four presidential elections between 2008 and 2020, it received 50 of the 58 general-election events that took place in the 13 smallest states (as shown in table 9.2).
Thus, New Hampshire received 4.2% of the nation’s general-election campaign events even though it has only 0.42% of the nation’s population.
Because Maine awards electoral votes by congressional district, and its 2nd district was closely divided in three of the four elections between 2008 and 2020, it received some attention (two or three events) in those elections.
Meanwhile, Wyoming, Vermont, North Dakota, Alaska, South Dakota, Delaware, Montana, Rhode Island, Hawaii, and Idaho were all ignored not because they were small, but because presidential candidates had nothing to gain by paying any attention to their voters under the winner-take-all system.
In short, the table shows that the determinant of whether a state receives attention is whether it is a closely divided state at the state level or, in the case of Maine, whether its 2nd congressional district happened to be competitive in a particular year.
In a nationwide vote for President, every voter in every state would be equally important in every presidential election. Under a national popular vote, a voter in a small state would become as important as any other voter in the United States. Moreover, in many cases, small states offer presidential candidates the attraction of considerably lower per-impression media costs (section 9.13.7).
The fact that serious candidates solicit every voter who matters was further demonstrated in 2008 by Nebraska’s 2nd congressional district (the Omaha area). The Obama campaign operated three separate campaign offices staffed by 16 people there. The Campaign Media Analysis Group at Kantar Media reported that $887,433 worth of ads were run in the Omaha media market in 2008.[238] The reason for this activity in the Omaha area was that Nebraska awards electoral votes by congressional district. The campaigns paid attention to the 2nd district, because it was closely divided and because one electoral vote was at stake. The outcome in 2008 was that Barack Obama carried the 2nd district by 3,378 votes and thus won one electoral vote from Nebraska.
The fact that serious candidates solicit every vote that matters was also demonstrated by the fact that Mitt Romney opened a campaign office in Omaha in July 2012 in order to compete in Nebraska’s 2nd district[239] and that the Obama campaign was also active in the Omaha area at the time.[240]
One Nebraska State Senator whose district lies partially in the 2nd congressional district reported a heavy concentration of lawn signs, mailers, precinct walking, telephone calls to voters, and other campaign activity related to the 2008 presidential race in the portion of his state senate district that was inside the 2nd congressional district, but no such activity in the remainder of his state senate district. Indeed, neither the Obama nor the McCain campaigns paid the slightest attention to the people of Nebraska’s heavily Republican 1st district or heavily Republican 3rd district, because it was a foregone conclusion that McCain would win both of those districts. The issues relevant to voters of the 2nd district (the Omaha area) mattered, while the issues relevant to Nebraska’s remaining two districts did not.
When votes matter, presidential candidates vigorously solicit those voters. When votes don’t matter, they ignore those areas.
Footnotes
[238] The 2008 ad spending figure was reported in Steinhauser, Paul. Nevada number one in ad spending per electoral vote. CNN Politics. July 4, 2012.
[239] Walton, Don. Romney will compete for Omaha electoral vote. Lincoln Journal Star. July 19, 2012.
[240] Henderson, O. Kay. Obama trip targets seven electoral college votes in Iowa, Nebraska. Radio Iowa. August 13, 2012.
9.3.5 MYTH: The small states oppose a national popular vote for President.
QUICK ANSWER:
- The fact that the small states are disadvantaged by the current state-by-state winner-take-all method of awarding electoral votes has long been recognized by prominent officials from small states. In 1966, the state of Delaware led a group of 12 predominantly small states in bringing a lawsuit at the U.S. Supreme Court aimed at getting winner-take-all laws declared unconstitutional. The plaintiffs argued that the winner-take-all method of awarding electoral votes is unconstitutional because it “debases the national voting rights and political status of plaintiff’s citizens and those of other small states.”
- As of July 2024, the National Popular Vote Compact has been enacted into law by six small states (Delaware, Hawaii, Maine, Rhode Island, Vermont, and the District of Columbia).
- Polls of public support for a national popular vote for President in small states are substantially the same as those in medium-sized and big states.
Prominent officials from small states have long recognized the fact that the small states are disadvantaged by the current state-by-state winner-take-all method of awarding electoral votes.
Lawsuit by Delaware and other small states challenging the winner-take-all rule
In 1966, the state of Delaware and a group of 11 predominantly small states (including North Dakota, South Dakota, Wyoming, Utah, Arkansas, Kansas, Oklahoma, Iowa, Kentucky, Florida, and Pennsylvania) argued before the U.S. Supreme Court that the state-by-state winner-take-all rule:
“debases the national voting rights and political status of Plaintiff’s citizens and those of other small states.”[241] [Emphasis added]
This lawsuit was filed after the flurry of Supreme Court decisions in the 1960s that established the one-person-one-vote principle in connection with congressional and state legislative districts.
Defendant New York’s political importance in presidential elections in the 1960s cannot be overemphasized. New York was not only a closely divided state, but it was the nation’s biggest state at the time. It possessed the largest number of electoral votes (45). None of the prominent battleground states in recent elections (e.g., Ohio, Pennsylvania, Florida) has been the biggest or even second-biggest state.
Delaware Attorney General David P. Buckson (R) led the effort. The plaintiff’s brief in State of Delaware v. State of New York argued:
“The state unit-vote system [winner-take-all] debases the national voting rights and political status of Plaintiff’s citizens and those of other small states by discriminating against them in favor of citizens of the larger states. A citizen of a small state is in a position to influence fewer electoral votes than a citizen of a larger state, and therefore his popular vote is less sought after by major candidates. He receives less attention in campaign efforts and in consideration of his interests.”[242] [Emphasis added]
Delaware’s brief also stated:
“This is an original action by the State of Delaware as parens patriae for its citizens, against the State of New York, all other states, and the District of Columbia under authority of Article III, Section 2 of the United States Constitution and 28 U.S. Code sec. 1251. The suit challenges the constitutionality of the respective state statutes employing the ‘general ticket’ or ‘state unit-vote’ system, by which the total number of presidential electoral votes of a state is arbitrarily misappropriated for the candidate receiving a bare plurality of the total number of citizens’ votes cast within the state.
“The Complaint alleges that, although the states, pursuant to Article II, Section 1, Par. 2 of the Constitution, have some discretion as to the manner of appointment of presidential electors, they are nevertheless bound by constitutional limitations of due process and equal protections of the laws and by the intention of the Constitution that all states’ electors would have equal weight. Further, general use of the state unit system by the states is a collective unconstitutional abridgment of all citizens’ reserved political rights to associate meaningfully across state lines in national elections.” [Emphasis added]
The plaintiff’s brief argued that the votes of the citizens of Delaware and the other plaintiff states are:
“diluted, debased, and misappropriated through the state unit system.”
The U.S. Supreme Court declined to hear the case (presumably because the choice of manner of awarding electoral votes is exclusively a state decision under McPherson v. Blacker).
Ironically, the defendant New York is no longer a battleground state. Today, New York suffers the very same disadvantage as Delaware, because it is now politically noncompetitive in presidential elections. Today, a voter in New York is equal to a voter in Delaware—both are politically irrelevant in presidential elections.
The Compact has been enacted by six small states.
As of July 2024, the National Popular Vote Compact has been enacted into law by six small states (Delaware, Hawaii, Maine, Rhode Island, Vermont, and the District of Columbia).
Public opinion in small states supports national popular vote.
Public support for a national popular vote for President is substantially the same in state-level polls of small states, medium-sized states, and big states, as discussed in detail in section 9.22.
Footnotes
[241] State of Delaware v. State of New York. 385 U.S. 895. 1966.
[242] Delaware’s brief in the 1966 case may be found at https://www.nationalpopularvote.com/elevenplaintiffs. New York’s brief may be found at https://www.nationalpopularvote.com/newyorkbrief. Delaware’s argument in its request for a re-hearing may be found at https://www.nationalpopularvote.com/delawarebrief.
9.3.6 MYTH: Equal representation of the states in the U.S. Senate is threatened by the National Popular Vote Compact.
QUICK ANSWER:
- The composition of the U.S. Senate is established and protected by the U.S. Constitution. It cannot be changed by passage of any state law or any interstate compact. In fact, equal representation of the states in the U.S. Senate cannot even be changed by an ordinary constitutional amendment, but instead can only be changed by unanimous consent of all 50 states.
- Changing the winner-take-all method of awarding electoral votes would have no effect on the equal representation of the states in the U.S. Senate.
Equal representation of the states in the U.S. Senate is explicitly established and protected in the U.S. Constitution.
The composition of the U.S. Senate cannot be changed by the passage of any state law or any interstate compact.
In fact, equal representation of the states in the U.S. Senate may not even be amended by an ordinary federal constitutional amendment. Article V of the U.S. Constitution provides:
“No State, without its Consent, shall be deprived of its equal Suffrage in the Senate.”
That is, this feature of the U.S. Constitution may only be changed by a constitutional amendment that, in addition to the usual requirements, is approved by unanimous consent of all 50 states.
The National Popular Vote Compact is concerned with the method of selecting members of the Electoral College. The power to change the method of selecting the manner of appointing presidential electors is explicitly granted to each state by the U.S. Constitution:
“Each State shall appoint, in such Manner as the Legislature thereof may direct, a Number of Electors.”[243]
Changing the winner-take-all method of awarding electoral votes would have no effect on the equal representation of the states in the U.S. Senate.
Footnotes
[243] U.S. Constitution. Article II, section 1, clause 2.