- 9.2.1 MYTH: The current system ensures that presidential candidates reach out to all states.
- 9.2.2 MYTH: A national popular vote will simply make a different group of states irrelevant in presidential elections.
- 9.2.3 MYTH: The disproportionate attention received by battleground states is not a problem because spectator states frequently become battleground states and vice versa.
9.2.1 MYTH: The current system ensures that presidential candidates reach out to all states.
QUICK ANSWER:
- Far from ensuring that presidential candidates reach out to all states, the current state-by-state winner-take-all method of electing the President resulted in four out of five states being ignored in the 2012 general-election campaign for President.
- In 2012, Obama conducted campaign events in just eight states after being nominated, and Romney did so in only 10 states.
- In 2012, only 12 states received even one post-convention campaign event involving a presidential or vice-presidential candidate.
- Two thirds of the presidential and vice-presidential post-convention campaign events were conducted in just four states in 2012 (Ohio, Florida, Virginia, and Iowa).
- Only three of the 25 smallest states received any attention in the post-convention campaign period in 2012.
- The South is largely ignored in presidential elections because of the state-by-state winner-take-all system.
- Advertising spending was also heavily concentrated in the 12 states where the presidential and vice-presidential candidates held post-convention general-election campaign events in 2012.
- Campaign field offices were also heavily concentrated in the 12 states where the presidential and vice-presidential candidates held post-convention general-election campaign events in 2012.
- The number of battleground states has been consistently shrinking in recent decades.
Tara Ross, an opponent of the National Popular Vote plan, has asserted in testimony at various state legislative hearings:
“Ultimately, the Electoral College ensures that the political parties must reach out to all the states.”[157] [Emphasis added]
“[Under the current system] candidates can’t win unless they build nationwide support.”[158] [Emphasis added]
Nothing could be further from the truth.
Because of state winner-take-all statutes (i.e., awarding all of a state’s electoral votes to the candidate who receives the most popular votes in each separate state), four out of five states and four out of five Americans were systematically ignored in the general-election campaign for President in 2012.
The reason that four out of five states are ignored is that presidential candidates have no incentive to visit, advertise in, organize in, poll in, or pay attention to the voters in states where they are comfortably ahead or hopelessly behind.
There is simply no benefit to a presidential candidate to spend his limited campaigning time and money visiting, advertising in, and building a grassroots organization in a state in order to win that state with, say, 58% of a state’s popular vote as compared to, say, 55%. Similarly, it does not help a presidential candidate to lose a state with 45% of a state’s popular vote as compared to, say, 42%.
Because of this political reality, candidates understandably concentrate their attention on a small handful of closely divided battleground states.
As a general rule, a state needs to be approximately in the 46%54% range (and preferably closer) to be worthy of attention in the general-election campaign for President.[159] Because most political polls have a margin of error of plus or minus 3% or 4%, another way to state this rule-of-thumb is to say that battleground states are those where the difference between the candidates is inside the margin of error of a typical political poll.
2004 presidential campaign
In 2004, the presidential candidates concentrated two-thirds of their campaign events and money in the post-convention general election campaign in just five states, 80% in just nine states, and 99% in just 16 states. That’s hardly “reach[ing] out to all the states.”
2008 presidential campaign
In the spring of 2008even before the nominating process was completedthe major political parties acknowledged that there would be only about 14 battleground states in 2008.[160]
In the 2008 post-convention general election campaign, candidates concentrated over two-thirds of their campaign events and ad money in just six states, and 98% in 15 states.[161] All of the campaign events occurred in just 19 states.
Table 9.1 shows the states in which the presidential and vice-presidential candidates held their 300 post-convention general election campaign events in 2008. The table is sorted according to Obama’s percentage of the two-party vote in order to highlight the fact that the states that received campaign events are those where the two-party vote was close (that is, the states where Obama’s percentage of the two-party vote was near 50%).[162] The data comes from the Washington Post campaign tracker and was compiled by FairVote. The data cover the period from September 5 to November 4, 2008.[163]
Table 9.1 Post-convention campaign events in 2008
Referring to the 2008 election, Professor George C. Edwards III pointed out in his book Why the Electoral College Is Bad for America:
“Barack Obama campaigned in only fourteen states, representing only 33 percent of the American people, during the entire general election.”[164] [Emphasis added]
Senator John McCain campaigned in only 19 states in the post-convention period.
As table 9.1 shows, only 14 states received seven or more of the 300 post-convention general election campaign events in 2008.
- Ohio62 events,
- Florida46 events,
- Pennsylvania40 events,
- Virginia23 events,
- Missouri21 events,
- Colorado20 events,
- North Carolina15 events,
- Nevada12 events,
- New Hampshire12 events,
- Michigan10 events,[165]
- Indiana9 events,
- New Mexico8 events,
- Wisconsin8 events, and
- Iowa7 events.
These 14 closely divided battleground states accounted for 97.7% of the 300 post-convention campaign events in the 2008 general election campaign (that is, 293 of the 300 events).[166]
Moreover, half of these 300 post-convention campaign events in 2008 (148 of 300) were in Ohio (62 events), Florida (46 events), and Pennsylvania (40 events).
Defenders of the current state-by-state winner-take-all system not only incorrectly assert that it “ensures that the political parties must reach out to all the states,” but they also incorrectly assert that the current system forces candidates to pay attention to small states. Their claim about small states is not supported by the facts.
Campaign events were held in only seven of the 25 smallest states in 2008. Moreover, the vast majority of the events held in the 25 smallest states (39 of 43) occurred in just four states, namely
- New Hampshire (12 events),
- New Mexico (8 events),
- Nevada (12 events), and
- Iowa (7 events).
The 25 smallest states together (with 115 electoral votes in 2008) received 43 post-convention campaign events. In contrast, Ohio (with only 20 electoral votes in 2008) received 62 of the 300 post-convention campaign events. The fact that small states are ignored by the current system of electing the President is made clear by table 9.7 in which the data from table 9.1 are sorted according to each state’s number of electoral votes.
The South is also largely ignored by presidential campaigns. In an article entitled “The Electoral College is stacked against the South” in Southern Political Report, Professor John A. Tures summarized the political effect on the South of the current state-by-state winner-take-all system:
“The South is largely disenfranchised by the Electoral College.”[167]
As one might expect, the money that presidential candidates spend in the various states generally parallels the distribution of campaign events.
Table 9.2 shows the states ranked in order of their total contributions (column 2) to the 2008 presidential campaign (using data from Federal Elections Commission records compiled by FairVote).[168] Column 3 shows the percentage of total national donations for each state. Column 4 shows the peak-season candidate advertising expenses (using data compiled by CNN) covering the period from September 24, 2008 (two days before the first presidential debate) to Election Day. Column 5 shows the percentage of total national peak-season candidate advertising expenses for each state.[169]
Table 9.2 Campaign donations and advertising spending for 2008
Table 9.2 shows that:
- 99.75% of all advertising spending was in just 18 states in 2008. This allocation substantially parallels the allocation of the 300 post-convention campaign events to just 19 states, and
- 32 states received a combined total of only ¼% of the advertising money in 2008.
Table 9.2 also shows that the 18 net “importers” of campaign money received 99.75% of all advertising money (while providing only 27.70% of all donations). The top six “exporting” states (California, New York, Illinois, Texas, Virginia, and the District of Columbia) made 60% of the donations, but received only 0.06% of the advertising money. For example, California donors contributed $151,127,483 (about one-sixth of the national total), but California received a mere $28,288 in advertising. New York donors contributed $89,538,628 (about one-tenth of the national total), while New York received only $2,235 in advertising.
2012 presidential campaign
The number of battleground states has been declining for many decades, as detailed in FairVote’s 2005 report entitled The Shrinking Battleground.[170] This shrinkage continued into the 2012 presidential election.
A mere four weeks after the November 2010 congressional elections, a televised debate on C-SPAN among candidates for the chairmanship of the Republican National Committee focused on the question of how the party would conduct the 2012 presidential campaign in the 14 states that were expected to matter.[171]
Five and a half months before Election Day in 2012, Governor Mitt Romney acknowledged that the number of battleground states in 2012 would be even smaller than in 2008. In the now-famous May 17, 2012, Mother Jones video (made at the same fund-raising dinner in Boca Raton, Florida, containing Romney’s comments about “the 47%”), Romney said:
“All the money will be spent in 10 states.”
On June 6, 2012 (five months before Election Day), the New York Times reported that the 2012 presidential campaign was effectively being conducted in nine battleground states (Florida, Ohio, Virginia, North Carolina, Iowa, Pennsylvania, Colorado, Nevada, and New Hampshire). The article noted that the number of battleground states was considerably smaller than in 2000, 2004, and 2008.[172]
Table 9.3 shows the states in which the presidential and vice-presidential candidates held their 253 post-convention general-election campaign events in 2012. This table is based on CNN’s “On the Trail” campaign tracker and covers the period from September 7, 2012 (the day after the Democratic National Convention) to November 6 (Election Day).[173] The data was compiled by FairVote. The table is sorted according to column 2 (showing the total number of campaign events per state).[174] Columns 3, 4, 5, and 6 show the number of events by President Barack Obama, Vice President Joe Biden, Governor Mitt Romney, and Congressman Paul Ryan, respectively.
Table 9.3 Post-convention campaign events in 2012
As can be seen from table 9.3:
- In 2012, President Obama conducted post-convention campaign events in just eight states after being nominated, and Governor Romney did so in only 10 states. In comparison, in 2008, Obama conducted post-convention events in 14 states, and McCain did so in 19 states.
- Four out of five states (and four out of five Americans) were ignored by the candidates in the post-convention campaign period in 2012.
- Ohio received 73 of the 253 post-convention campaign events (29%).
- Over two-thirds (69%) of the post-convention campaign events were conducted in just four states (Ohio, Florida, Virginia, and Iowa).
- Only one of the 13 smallest states (i.e., those with three or four electoral votes) received any post-convention campaign events (New Hampshire).
- Only three of the 25 smallest states (i.e., those with seven or fewer electoral votes) received any post-convention campaign events (New Hampshire, Iowa, and Nevada).
- In 2012, only 12 states received at least one post-convention campaign event involving a presidential or vice-presidential candidate.
- The battle was fully joined in only eight states. That is, only eight states received campaign events from all four major-party candidates (i.e., Obama, Romney, Biden, and Ryan).
Figure 9.1 is a graphical representation of the same information as table 9.3 concerning the states in which the presidential and vice-presidential candidates held their 253 post-convention general-election campaign events in 2012.
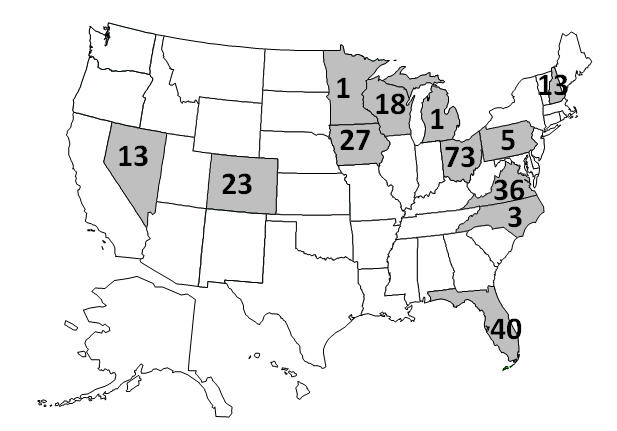
Figure 9.1 Post-convention campaign events in 2012
The top eight battleground states shown in table 9.3 accounted for 96% of the 253 campaign events. They had a combined population of 56,334,828 out of the total U.S. population of 309,785,186 (according to the 2010 census). That is, these eight states had 18.1% of the nation’s population.
North Carolina was generally regarded as the ninth significant battleground state in 2012. It was sixth in terms of advertising spending (table 9.4) but tenth in terms of campaign events in table 9.3. These nine states had a combined population of 65,900,609that is, 21.3% of the nation’s population.
Thus, in round numbers, the 2012 presidential campaign ignored about four out of five Americans.
Although defenders of the current state-by-state winner-take-all system often incorrectly assert that the current system forces candidates to pay attention to small states, that claim is not supported by the facts.
Campaign events were held in only three of the 25 smallest states in 2012, namely
- Iowa (27 events),
- Nevada (13 events), and
- New Hampshire (13 events).
The 25 smallest states together (possessing 116 electoral votes in 2012) received 53 of the 253 post-convention campaign events. In contrast, Ohio (with only 18 electoral votes in 2012) received 73 of the 253 post-convention campaign events.[175]
The advertising money that was spent in the various states was just as skewed as the distribution of campaign events.
Table 9.4 shows the advertising spending by the presidential campaign organizations and their supportive outside groups (e.g., super-PACs, 501(c)4 corporations) for each of the 12 states (shown in table 9.3) where at least one of the four candidates of the major parties (Obama, Romney, Biden, and Ryan) conducted at least one campaign event. The table is arranged in descending order according to the total advertising spending by state (shown in column 2). Column 3 shows each state’s percentage of the total of $939,370,708 for the 12 states. Column 4 shows the total for the Obama campaign (Obama for America) and supportive Democratic groups (Priorities USA Action and Planned Parenthood Action Fund).[176] Column 5 shows the total for the Romney campaign (Romney for President) and supportive Republican groups (American Crossroads, Restore Our Future, Crossroads GPS, Americans for Prosperity, Republican National Committee, Americans for Job Security, American Future Fund, and Concerned Women for America). These data were compiled by National Journal.[177] The data cover the period between September 4, 2012 (the middle of the Democratic National Convention) and November 4, 2012 (two days before Election Day).[178]
Table 9.4 Post-convention advertising spending in 12 states in 2012
The battle for the White House was not meaningfully joined in the three states in table 9.4 with the lowest non-zero advertising expenditures, namely Minnesota, Michigan, and Pennsylvania.
In Minnesota, Democrats spent nothing in pursuit of the state’s 10 electoral votes, while Republicans spent a mere 5% of what they spent trying to win the 10 electoral votes in neighboring Wisconsin. Moreover, neither Obama, Romney nor Biden conducted any post-convention events in the state (as shown in table 9.3).
In Michigan, Democrats spent next to nothing ($461,008) in pursuit of the state’s 16 electoral votes, while Republican spent (mostly at the last minute) a mere one-sixth of what they spent trying to win Ohio’s 18 electoral votes. Congressman Ryan conducted one post-convention events in Michigan (as shown in table 9.3).
Although Pennsylvania was a major battleground state in 2008 (receiving 40 of the 300 post-convention campaign events), the battle was never meaningfully joined in Pennsylvania in 2012. Neither Obama nor Biden conducted any post-convention events in Pennsylvania (as shown in table 9.3). The three last-minute events by Romney and the two last-minute events by Ryan were a token effort (a tiny fraction of the 253 post-convention campaign events). The spending in pursuit of Pennsylvania’s 20 electoral votes (mostly last-minute) was less than one-sixth of what was spent in pursuit of Ohio’s 18 electoral votes.
Overall, 98% of the $939,370,708 spent on advertising in the 12 states in 2012 shown in table 9.4 was concentrated in just 10 states, and 95% was spent in just nine states.
The location of field offices confirms the degree to which presidential campaigns concentrated their efforts on the closely divided battleground states.
As discussed in a report entitled “Tracking Presidential Campaign Field Operations” by Andrea Levien of Fair Vote,[179] President Obama’s field operation had a total of 790 campaign offices, with at least one in every state. However, there was only one Obama office in 25 states.
Governor Romney’s field operation had a total of 284 offices; however, all were located in just 16 states. That is, 34 states had no Romney office.
Table 9.5 shows that 87% of Obama’s campaign offices (690 of 790) were in the 12 states where either President Obama, Vice President Biden, Governor Romney, or Congressman Ryan conducted at least one campaign event (shown in table 9.3)
Table 9.5 Location of 690 of Obama’s 790 campaign offices in 2012
Table 9.6 shows that 92% of Romney’s campaign offices (262 of 284) were in the 12 states where either President Obama, Vice President Biden, Governor Romney, or Congressman Ryan conducted at least one campaign event (shown in table 9.3).
Table 9.6 Location of 262 of Romney’s 284 campaign offices in 2012
In summary, about 90% of all campaign offices were concentrated in 12 states in 2012.
Campaigns solicit votes based on issues of concern to battleground states
The practical political effect of presidential candidates ignoring four out of five states and four out of five voters is that they pay inordinate attention to the issues of concern to the voters living in closely divided battleground states.
Candidates direct their campaign appeals to the issues of concern to the voters of the closely divided battleground states.
For example, an article entitled “Romney Campaign Releases 15 New Commercials in Eight States” illustrates how presidential campaigns solicit votes based on particular issues relevant to voters in particular battleground states:
“All 15 spots begin identicallywith convention footage of Romney's acceptance speech.
“From there, it starts getting less generic.
“[The] Florida [ad discusses] the importance of residential real estate to the state's economy.
“A Virginia commercial [deals with] residential real estate
“One of [the] commercials deals with losses resulting from defense-budget cuts and sequestrations, is running in Colorado, Florida, North Carolina, Ohio and Virginia.
“Another [commercial] discussing how government overregulation kills small-business jobs runs in Colorado and Iowa.
“[Another commercial] about government regulatory, trade and tax policies killing manufacturing jobs, runs in North Carolina and Ohio.
“[There is] a New Hampshire commercial about high taxes and energy costs.
“[There is] a Virginia [30-second ad] about how tax cuts can help the lives of middle-class families.”[180] [Emphasis added]
A 2012 Washington Post article entitled “Obama Showering Ohio with Attention and Money” reported:
“After President Obama pledged in March to create up to 15 manufacturing centers nationwide, the first federal grant went to a place at the heart of his affections: Ohio.
“When the Obama administration awarded tax credits to promote clean energy, the $125 million taken home by Ohio companies was nearly four times the average that went to other states.
“And when a Cleveland dairy owner wanted to make more ricotta cheese, he won what was then the largest loan in the history of the U.S. Small Business Administration.
“‘One of the tastiest investments the government has ever made,’ the president joked as he mentioned the dairy and other businesses his administration has helped in the state.”[181] [Emphasis added]
The same article also noted:
“Either Obama or Vice President Biden has popped up in the Buckeye State every three weeks on average since they took office.”
Not only do presidential candidates pay inordinate attention to the issues of concern to voters in the closely divided battleground states, they simply do not care about issues of concern to voters in non-battleground states. Because of the state-by-state winner-take-all method of awarding electoral votes, candidates do not even bother to conduct public opinion polls in the remaining states, because issues concerning voters in the non-battleground states are simply not relevant to winning the White House.
As Charlie Cook reported in 2004:
“Senior Bush campaign strategist Matthew Dowd pointed out yesterday that the Bush campaign hadn’t taken a national poll in almost two years; instead, it has been polling 18 battleground states.” [182],[183] [Emphasis added]
If candidates (and sitting Presidents contemplating re-election) are not even aware of the issues that concern voters in four out of five states, they are making policy based on the desires of a few at the expense of the many.
As Former White House Press Secretary Ari Fleischer said in 2009:
“If people don’t like it, they can move from a safe state to a swing state and see their president more.”[184] [Emphasis added]
State winner-take-all statutes are the reason why four out of five states and four out of five Americans are ignored in presidential elections. Under the current state-by-state winner-take-all system, voters in non-battleground states receive no attention from either political party because neither party has anything to gain or lose in the state.
The time that candidates spend in various states, as well as the amount of money that they spend, indicates the value that candidates place on the issues of concern to the voters of those states. Policy issues important to voters in the battleground states are more important to a presidential campaign than policy issues important to the voters in the 40-or-so spectator states. When a sitting President is governing (and contemplating his own re-election or the election of his preferred successor), policy issues important to voters in the battleground states are more important than policy issues important to voters in spectator states.
As former Illinois Governor Jim Edgar has said:
“People who are in elected office remember what they learned when they were campaigning. It’s important that the candidates campaign in all states, not just the swing states.” [Emphasis added]
Consider the reliably Republican state of Idaho as an example of a spectator state. Given George W. Bush’s 68% margin of victory in 2004, no amount of campaigning will alter the fact that the Republican nominee for President is virtually certain to win Idaho’s four electoral votes in the foreseeable future under the current system. Therefore, the Republican candidate for President risks nothing by ignoring Idaho voters, Idaho issues, and Idaho values. Similarly, the Democratic candidate has nothing to gain in Idaho and can simply write it off. The fact that Idaho is not a battleground state means that Idaho issues are irrelevant to both parties.
Under a national popular vote, every vote in Idaho would matter to both the Democratic and Republican nominee in every election. A vote in Idaho would become as valuable as a vote anywhere else in the country. It would be foolish for a Republican nominee to take Idaho voters for granted, because he or she would want to expand his margin of victory or, failing that, at least maintain his party’s historically large margin in the state. Similarly, it would be folly for the Democratic nominee to ignore Idaho voters, because he or she would want to decrease the magnitude of his loss or, at a minimum, limit his loss to his party’s historical level. Idaho’s reliably large Republican margin would no longer be wasted, and the votes of Idaho Democrats would no longer be counted as if they had voted for the Republican presidential candidate. Idaho voters are ignored because the state-by-state winner-take-all rule makes it pointless for either party’s presidential candidates to pay any attention to the state.
Note that Idaho is not ignored in presidential elections because it is smallit is ignored because it is not a closely divided battleground state. In 2012, the battleground state of New Hampshire (with the same four electoral votes as Idaho) received 13 of the 253 campaign events in the post-convention general election campaign, while all 12 of the other smallest states (including Idaho) received no attention at all.
If every vote was politically relevant in a presidential campaign, one would reasonably expect each of the 13 smallest states (that is, those with three or four electoral votes) to receive approximately one of the 13 campaign events that are currently conducted in New Hampshire. That is, it would be reasonable to expect each of the six Republican-leaning small states (Alaska, Idaho, Montana, Wyoming, North Dakota, and South Dakota) and each of the seven Democratic-leaning small states (Hawaii, Vermont, Maine, Rhode Island, Delaware, the District of Columbia, and New Hampshire) would receive one of these 13 campaign events.
Footnotes
[157] Oral and written testimony presented by Tara Ross at the Nevada Senate Committee on Legislative Operations and Elections on May 7, 2009.
[158] Written testimony submitted by Tara Ross to the Delaware Senate in June 2010.
[159] Virtually all of the states that were considered “battleground states” in 2008 (e.g., the states in table 9.1 that received campaign events and the states in table 9.2 that received substantial amounts of advertising money) lie in this range. This same pattern persisted in 2012 and applied to 2004 and 2000.
[160] Already, Obama and McCain Map Fall Strategies. New York Times. May 11, 2008.
[162] For the reader’s convenience, this same data are sorted according to the number of campaign events in table 1.10 and sorted by state size in table 9.7.
[163] This table is based on public campaign events (e.g., rallies, speeches, town hall meetings). It does not include private fund-raisers, private meetings (e.g., Palin's meetings with world leaders in New York), non-campaign events (e.g., the Al Smith Dinner in New York City or the Clinton Global Initiative dinner), televised national debates (e.g., flying into Mississippi, New York, Tennessee, and Missouri for the sole purpose of participating in the debate), or interviews in television studios (e.g., flying into New York City to do an interview). A “visit” to a state may consist of one or more individual events held at different places and times within the state. A joint appearance of a presidential and vice-presidential candidate is counted as one event.
[164] Edwards, George C., III. 2011. Why the Electoral College Is Bad for America. New Haven, CT: Yale University Press. Second edition. Pages 35.
[165] On October 2, 2010, the McCain campaign abruptly pulled out of Michigan after it concluded that McCain could not win Michigan. Thus, Michigan appears on this list even though it was a “jilted battleground” state.
[166] The remaining six of the 300 post-convention events (representing 2% of the events) occurred in five additional places, namely Maine (2 events), Minnesota (2 events), the District of Columbia (1 event), Tennessee (1 event), and West Virginia (1 event).
[167] Tures, John A. 2009. The Electoral College is stacked against the South. Southern Political Report. November 30, 2009.
[168] http://www.fairvote.org/following-the-money-campaign-donations-and-spending-in-the-2008-presidential-race.
[169] An alternative way of looking at these data is available in table 1.11 where the states are ranked in order of the data in column 4.
[170] FairVote. 2005. The Shrinking Battleground: The 2008 Presidential Election and Beyond. Takoma Park, MD: The Center for Voting and Democracy. http://archive.fairvote.org/?page=1555.
[171] Freedomworks debate on December 1, 2010, available at http://www.freedomworks.org/rnc.
[172] Peters, Jeremy W. Campaigns Blitz 9 Swing States in a Battle of Ads. New York Times. June 8, 2012.
[173] This count is based on public campaign events (e.g., rallies, speeches, town hall meetings). It does not include private fund-raisers, private meetings, non-campaign events (e.g., the Al Smith Dinner in New York City, the Clinton Global Initiative dinner), televised national debates (e.g., flying into a state just to participate in the debate), or interviews in television studios (e.g., flying into New York to do an interview). A “visit” to a state may consist of one or more individual events held at different places and times within the state. A joint appearance of a presidential and vice-presidential candidate is counted as one event. Additional information is available at http://www.fairvote.org/presidential-tracker.
[174] For the reader’s convenience, the same information is also presented in table 9.8 where is it sorted by state size.
[175] These facts are highlighted in table 9.3 in which the data from table 9.8 are sorted according to each state’s number of electoral votes.
[176] Note that the Democratic National Committee did not run any advertising for the 2012 Obama campaign.
[177] Bell, Peter and Wilson, Reid. Ad Spending in presidential battleground states. National Journal. November 4, 2012. http://www.nationaljournal.com/hotline/ad-spending-in-presidential-battleground-states-20120620. This web site also details the spending by each individual group.
[178] The cost per electoral vote of reaching voters in battleground states varies considerably from state to state. Television advertising is highly inefficient for many battleground states. For example, reaching voters in the populous southern part of the battleground state of New Hampshire (with four electoral votes) is highly inefficient because it requires advertising on premium-priced metropolitan Boston TV stations (that primarily reaches politically irrelevant voters in Massachusetts and Rhode Island). Similarly, reaching the northern part of the battleground state of Virginia requires advertising on pricey metropolitan Washington stations (that reaches many politically irrelevant voters in Maryland and the District of Columbia). In contrast, television advertising in the states of Florida, Colorado, and Nevada is more efficient in that it is seen mostly by voters living inside those battleground states.
[179] Levien, Andrea. Tracking presidential campaign field operations. Fair Vote report. November 14, 2012. http://www.fairvote.org/tracking-presidential-campaign-field-operations/.
[180] Goldman, Bruce. Romney campaign releases 15 new commercials in eight states. Examiner. September 7, 2012.
[181] Markon, Jerry and Crites, Alice. Obama showering Ohio with attention and money. Washington Post. September 25, 2012. https://www.washingtonpost.com/politics/decision2012/obama-showering-ohio-with-attention-and-money/2012/09/25/8ab15a68-019e-11e2-b260-32f4a8db9b7e_story.html?utm_term=.a0a8dd853617
[182] Cook, Charlie. 2004. Convention dispatchesAs the nation goes, so do swing states. Cook’s Political Report. August 31, 2004.
[183] John Kerry’s 2004 campaign similarly concentrated on a small handful of states in the general election campaign.
[184] Washington Post. June 21, 2009.
9.2.2 MYTH: A national popular vote will simply make a different group of states irrelevant in presidential elections.
QUICK ANSWER:
- Candidates must solicit every potential voter in an election in which the winner is the candidate who receives the most popular votes. Every vote, regardless of location, would matter equally under a national popular vote.
- The best indicator of how campaigns would be run under a national popular vote is the way campaigns are conducted today for offices where the winner is the candidate who receives the most votes. Serious candidates for Governor solicit voters throughout their entire state. No serious candidate ignores any part of a state if he or she is running in an election where the winner is the candidate who receives the most votes in the entire state. Inside battleground states, presidential candidates solicit voters throughout the entire state.
- When it is suggested that a national popular vote would make any state irrelevant in presidential elections, the obvious question is “Which state would that be?” Which 40 states would a presidential candidate totally ignore under a national popular vote? Which 240,000,000 Americans would a presidential candidate totally ignore in an election in which the winner is the candidate who receives the most popular votes?
Four out of five states and four out of five Americans are ignored in present-day presidential elections conducted under the state-by-state winner-take-all method of awarding electoral votes.
John Samples, an opponent of the National Popular Vote plan, has asserted:
“Many states now ignored by candidates will continue to be ignored under NPV.”[185]
We do not have to speculate on how a campaign would be conducted in an election in which the winner is the candidate who receives the most popular votes, because there is ample evidence available to answer this question. We know, from actual experience, how elections are conducted for every other office in the United States.
Serious candidates for Governor or U.S. Senator pay attention to their entire constituency. The reason is that every vote is equally important in winning an election in which the winner is the candidate who receives the most popular votes. Focus, for a moment, on a state’s congressional districts (remembering that congressional districts within a state contain virtually identical numbers of people). Serious candidates for Governor do not limit their campaigns to just one-fifth of their state’s congressional districts while totally ignoring four-fifths of the state. Taking Massachusetts as a specific example, it would be inconceivable for a serious candidate for Governor to campaign only in the 1st and 2nd congressional districts, while totally ignoring the 3rd, 4th, 5th, 6th, 7th, 8th, 9th, and 10th districts.
The same principle applies today in present-day presidential races inside each closely divided battleground state. Inside a battleground state, every vote is equal. Every vote helps a candidate get closer to winning the most votes in the state and thereby capturing all of the state’s electoral votes. Inside Ohio, for example, presidential candidates campaign throughout the state. Presidential candidates seek votes in Cleveland and Columbus as well as suburbs, exurbs, small towns, and rural areas. None of Ohio’s 16 congressional districts is ignored. Every method of communication (including television, radio, newspapers, magazines, direct mail, billboards, telephone, and the Internet) is used to reach every voter in Ohio. It would be politically preposterous to suggest that any presidential candidate would campaign in only certain parts of Ohio, to the exclusion of other parts. Every vote inside Ohio matters.
As David J. Owsiany of the Buckeye Institute wrote in the Columbus Dispatch:
“In a swing state such as Ohio, the candidates will visit every area of the state, not just the big cities, because they know winning the popular vote in Ohioregardless of the marginmeans the candidate will get all 18 of the Buckeye State’s electoral votes.”[186]
Similarly, the same is true inside Florida in present-day presidential elections. It would be preposterous to suggest that any presidential candidate would ignore any part of Florida because the winner of all of Florida’s 29 electoral votes is the candidate who receives the most votes in the state as a whole.
An NPR story entitled “Ads Slice Up Swing States With Growing Precision” reported on presidential campaigning in Colorado’s small media markets:
“Republicans outnumber Democrats in El Paso County more than 2 to 1. Barack Obama lost this part of Colorado to John McCain by 19 points in 2008.
“‘It's not a matter of just winning; it's winning by how much,’ says Rich Beeson, a fifth-generation Coloradan and political director for the Romney campaign.
“Presidential campaigns know exactly the margin of victory or defeat that they have to hit in each town in order to carry an entire state. Democratic media strategist Tad Devine says campaigns set extremely specific goals based on hard data.
“Although no one suggests that President Obama will win Colorado Springs, whether he loses it by 15 or 25 points could determine whether he carries Colorado.
“Beeson of the Romney campaign says smaller cities are vital to this chess game, especially since they're cheaper to advertise in.
“‘A lot of secondary markets are very key to the overall map, whether it's a Charlottesville in Virginia or a Colorado Springs in Colorado,’ he says. ‘You can't ever cede the ground to anyone.’”[187] [Emphasis added]
When it is suggested that a national popular vote will make a different group of states irrelevant in presidential elections, the obvious question is “Which states would that be?” Which 40 states would a presidential candidate totally ignore? “Which 240,000,000 Americans (four-fifths of the total U.S. population of 309,000,000) would a presidential candidate totally ignore?
The question answers itself.
Under the National Popular Vote plan, the winner would be the candidate who receives the most popular votes in the entire country. Every voter in every state would be politically relevant in every presidential election.
Footnotes
[185] Samples, John. A Critique of the National Popular Vote Plan for Electing the President. Cato Institute Policy Analysis No. 622. October 13, 2008. Page 1.
[186] Owsiany, David J. Electoral College helps to make sure that president represents entire nation. Columbus Dispatch. September 22, 2012.
[187] Shapiro, Ari. Ads slice up swing states with growing precision. NPR. September 24, 2012. http://www.npr.org/2012/09/24/161616073/ads-slice-up-swing-states-with-growing-precision.
9.2.3 MYTH: The disproportionate attention received by battleground states is not a problem because spectator states frequently become battleground states and vice versa.
QUICK ANSWER:
- Although spectator states do occasionally become battleground states, and vice versa, a state’s political complexion generally changes very slowly.
- A person can easily live out most or all of his or her life without ever being politically relevant in a general-election presidential campaign. In contrast, a person’s vote for Governor, U.S. Senator, or any other elective office is politically relevant in every electionnot just once or twice in a lifetime.
- Thirty-two states have voted for the same political party in the six presidential elections between 1992 and 201219 states possessing 242 electoral votes voted Democratic and 13 states possessing 102 electoral votes voted Republican.
Opponents of the National Popular Vote plan often argue that the current system forces presidential candidates to pay attention to all the states. For example, Tara Ross has asserted in testimony at various state legislative hearings:
“Ultimately, the Electoral College ensures that the political parties must reach out to all the states.”[188] [Emphasis added]
“[Under the current system] candidates can’t win unless they build nationwide support.”[189] [Emphasis added]
When facts are presented that contradict this manifestly incorrect claim (as they are in section 9.2.1), these same opponents then retreat to the argument that the disproportionate attention received by battleground states is not a problem because spectator states sometimes become battleground states and vice versa.
For example, Tara Ross, has argued that
“safe states and swing statesthey change all the time.”
“California, used to vote Republican. Now they vote Democrat.”[190]
Although it is true that spectator states do occasionally become battleground states (and vice versa), the rate of change in a state’s political complexion is generally rather slow.
A person can easily live out most or all of his or her r entire life without ever having a meaningful vote in a general-election presidential campaign. The year 2012 is the 100th anniversary of the last time the popular-vote margin in Utah and Nebraska was less than 6%.
Moreover, battleground status is generally fleeting. Battleground status typically occurs during the relatively brief period when a state is in the process of switching its allegiance from one political party to another. In most cases, a state is a battleground state for one or two (and occasionally three) consecutive presidential elections.
New Mexico voted Republican in presidential elections for decades prior to 2000. Between 2000 and 2008, New Mexico was a closely divided battleground state and consequently received considerable attention. However, New Mexico was totally ignored in the 2012 presidential campaign (receiving not a single post-convention campaign event).
After decades of voting solidly Republican in presidential elections, Virginia and North Carolina suddenly emerged as battleground states in 2008 (and they remained so in 2012).
California voted Republican in all six presidential elections between 1968 and 1988. During this period, California was meaningfully contested only in 1976 (when Ford won by 1.7%) and 1988 (when George H.W. Bush won by 3.5%). However, between 1992 and 2012, California has consistently voted Democratic in all six presidential elections.
Missouri was a battleground state in 2000 and 2008, but ignored in 2004. Moreover, Missouri was totally ignored in 2012.
Ohio was ignored (“dark” in the parlance of campaign consultants) as recently as the 2000 election. Al Gore and George W. Bush both stopped campaigning there shortly after being nominated.
In 2012, Pennsylvania was not a battleground state, even though it enjoyed battleground status in several previous elections. Pennsylvania received 40 of the 300 post-convention campaign events in 2008, but only a token (last-minute) five of 253 in 2012. Neither President Obama nor Vice President Biden campaigned there after being nominated.
Battleground status is so fleeting that a state can find itself jilted in the middle of the post-convention campaign. On October 2, 2008, the McCain campaign (quite reasonably) decided it could not win Michigan and abruptly pulled out of the state. Michigan was not a battleground state in 2012. It received only one of the 253 post-convention campaign events (from Congressman Ryan).
Despite isolated examples of states whose battleground status has changed, the overall picture is one of great stability and only gradual change.
Table 9.41 shows that 32 states voted for the same political party in all six presidential elections between 1992 and 2012. These 32 states possess about two-thirds (64%) of the 538 votes in the Electoral College. Of these 32 states, 19 states (possessing 242 electoral votes after the 2010 census) voted Democratic in all six presidential elections, and 13 states (possessing 102 electoral votes after the 2010 census) voted Republican in all six presidential elections.
In presidential elections, the importance of a vote depends on whether other voters in the voter’s state favor one candidate by 54% or so. Unless the voter happens to live in a state where opinion is closely divided (that is, between 46% and 54%), a person’s vote is politically irrelevant in presidential elections.
If the 2016 presidential election is conducted under the state-by-state winner-take-all rule and is reasonably close, it is likely that all (or almost all) of the 32 states that have voted for the same party in the past six presidential elections will support that same party.[191]
When a voter votes for Governor, U.S. Senator, or any other office in the United States, every vote in every precinct (and town and county) is equally relevant in every election. A person’s vote in a particular county is not ignored in an election for Governor simply because more than 54% of the voter’s neighbors in that county favor a particular candidate.
A nationwide vote for President would guarantee that every vote in every state would be equally relevant in every presidential election.
Footnotes
[188] Oral and written testimony presented by Tara Ross at the Nevada Senate Committee on Legislative Operations and Elections on May 7, 2009.
[189] Written testimony submitted by Tara Ross to the Delaware Senate in June 2010.
[190] Debate at the Dole Institute in Lawrence, Kansas, between Tara Ross and John Koza on November 7, 2011. Time stamp 16:30.
[191] Nine of the states in table 9.41 that voted Democratic once or twice between 1992 and 2012 (Arkansas, Kentucky, Louisiana, Missouri, Tennessee, West Virginia, Arizona, Georgia, and Montana) did so during the Clinton years. Since then, these nine states have consistently voted Republican in presidential elections between 2000 and 2012. Thus, there are 41 states that have voted for the same party between 2000 and 2012.