Political influence in the Electoral College is based on whether the state is a closely divided battleground state. Under the current state-by-state winner-take all method of awarding electoral votes, presidential candidates ignore states where they are safely ahead or hopelessly behind.
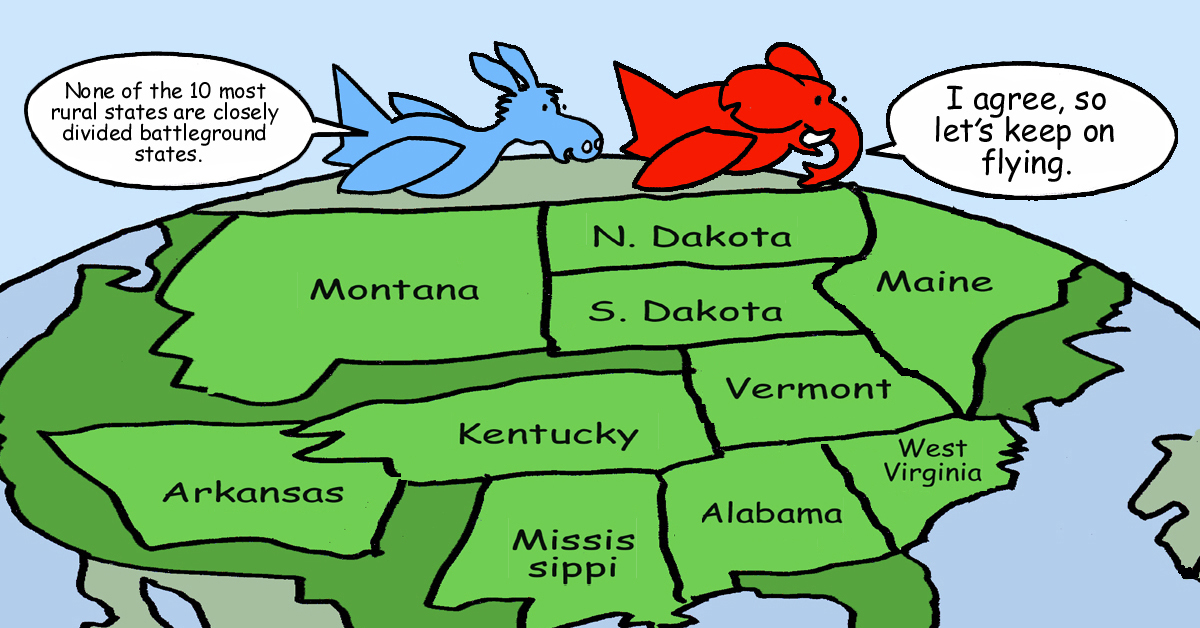
However, none of the 10 most rural states were closely divided battleground states in either the 2012 or 2016 presidential election. Thus, none of these 10 states received any general-election campaign visits.
Moreover, only five states of the 25 most rural states received any general-election campaign visits during the 2012 and 2016 presidential election, namely New Hampshire (12th most rural), Iowa (the 13th most rural), North Carolina (the 16th most rural), Wisconsin (the 20th most rural), and Minnesota (the 25th most rural).
According to the 2010 census, the 10 states with the highest percentage of rural residents are
- Maine–61%
- Vermont–61%
- West Virginia–51%
- Mississippi–51%
- Montana–44%
- Arkansas–44%
- South Dakota–43%
- Kentucky–42%
- Alabama–41%
- North Dakota–40%
In short, rural states are almost entirely ignored by the current state-by-state winner-take-all method of awarding electoral votes.
In the table below, column 2 shows each state’s total population. Column 3 shows the state’s urban-suburban population. Column 4 shows the state’s rural population. Column 5 shows the percentage of the state’s population that is rural (column 4 divided by column 2). Column 6 shows the state’s “rural index”—obtained by dividing the state’s rural percentage by the overall national rural percentage of 19.27%. An index above 100 indicates that the state is more rural than the nation as a whole, whereas an index below 100 indicates that the state is less rural. The states appear in the table in order of rural index—from most rural state to least rural.
|
State |
Total population |
Urban-suburban population |
Rural population |
Rural percent |
Index |
|
Maine |
1,328,361 |
513,542 |
814,819 |
61% |
318 |
|
Vermont |
625,741 |
243,385 |
382,356 |
61% |
317 |
|
West Virginia |
1,852,994 |
902,810 |
950,184 |
51% |
266 |
|
Mississippi |
2,967,297 |
1,464,224 |
1,503,073 |
51% |
263 |
|
Montana |
989,415 |
553,014 |
436,401 |
44% |
229 |
|
Arkansas |
2,915,918 |
1,637,589 |
1,278,329 |
44% |
228 |
|
South Dakota |
814,180 |
461,247 |
352,933 |
43% |
225 |
|
Kentucky |
4,339,367 |
2,533,343 |
1,806,024 |
42% |
216 |
|
Alabama |
4,779,736 |
2,821,804 |
1,957,932 |
41% |
213 |
|
North Dakota |
672,591 |
402,872 |
269,719 |
40% |
208 |
|
N.H. |
1,316,470 |
793,872 |
522,598 |
40% |
206 |
|
Iowa |
3,046,355 |
1,950,256 |
1,096,099 |
36% |
187 |
|
Wyoming |
563,626 |
364,993 |
198,633 |
35% |
183 |
|
Alaska |
710,231 |
468,893 |
241,338 |
34% |
176 |
|
North Carolina |
9,535,483 |
6,301,756 |
3,233,727 |
34% |
176 |
|
Oklahoma |
3,751,351 |
2,485,029 |
1,266,322 |
34% |
175 |
|
South Carolina |
4,625,364 |
3,067,809 |
1,557,555 |
34% |
175 |
|
Tennessee |
6,346,105 |
4,213,245 |
2,132,860 |
34% |
174 |
|
Wisconsin |
5,686,986 |
3,989,638 |
1,697,348 |
30% |
155 |
|
Missouri |
5,988,927 |
4,218,371 |
1,770,556 |
30% |
153 |
|
Idaho |
1,567,582 |
1,106,370 |
461,212 |
29% |
153 |
|
Indiana |
6,483,802 |
4,697,100 |
1,786,702 |
28% |
143 |
|
Nebraska |
1,826,341 |
1,335,686 |
490,655 |
27% |
139 |
|
Louisiana |
4,533,372 |
3,317,805 |
1,215,567 |
27% |
139 |
|
Minnesota |
5,303,925 |
3,886,311 |
1,417,614 |
27% |
139 |
|
Kansas |
2,853,118 |
2,116,961 |
736,157 |
26% |
134 |
|
Michigan |
9,883,640 |
7,369,957 |
2,513,683 |
25% |
132 |
|
Georgia |
9,687,653 |
7,272,151 |
2,415,502 |
25% |
129 |
|
Virginia |
8,001,024 |
6,037,094 |
1,963,930 |
25% |
127 |
|
New Mexico |
2,059,179 |
1,594,361 |
464,818 |
23% |
117 |
|
Ohio |
11,536,504 |
8,989,694 |
2,546,810 |
22% |
115 |
|
Pennsylvania |
12,702,379 |
9,991,287 |
2,711,092 |
21% |
111 |
|
Oregon |
3,831,074 |
3,104,382 |
726,692 |
19% |
98 |
|
Delaware |
897,934 |
747,949 |
149,985 |
17% |
87 |
|
Washington |
6,724,540 |
5,651,869 |
1,072,671 |
16% |
83 |
|
Texas |
25,145,561 |
21,298,039 |
3,847,522 |
15% |
79 |
|
Colorado |
5,029,196 |
4,332,761 |
696,435 |
14% |
72 |
|
Maryland |
5,773,552 |
5,034,331 |
739,221 |
13% |
66 |
|
New York |
19,378,102 |
17,028,105 |
2,349,997 |
12% |
63 |
|
Connecticut |
3,574,097 |
3,144,942 |
429,155 |
12% |
62 |
|
Illinois |
12,830,632 |
11,353,553 |
1,477,079 |
12% |
60 |
|
Arizona |
6,392,017 |
5,740,659 |
651,358 |
10% |
53 |
|
Utah |
2,763,885 |
2,503,595 |
260,290 |
9% |
49 |
|
Rhode Island |
1,052,567 |
955,043 |
97,524 |
9% |
48 |
|
Florida |
18,801,310 |
17,139,844 |
1,661,466 |
9% |
46 |
|
Hawaii |
1,360,301 |
1,250,489 |
109,812 |
8% |
42 |
|
Massachusetts |
6,547,629 |
6,021,989 |
525,640 |
8% |
42 |
|
Nevada |
2,700,551 |
2,543,797 |
156,754 |
6% |
30 |
|
New Jersey |
8,791,894 |
8,324,126 |
467,768 |
5% |
28 |
|
California |
37,253,956 |
35,373,606 |
1,880,350 |
5% |
26 |
|
D.C. |
601,723 |
601,723 |
0 |
0% |
0 |
|
Total |
308,745,538 |
249,253,271 |
59,492,267 |
19.27% |
100 |