Opponents of a nationwide vote for President have speculated that, in a national popular vote for President, candidates will concentrate disproportionately on heavily populated metropolitan areas and ignore rural areas.
However, there is no need to speculate as to how presidential candidates would campaign in an election in which every vote is equal, and in which the winner is the candidate receiving the most popular votes.
If there were any tendency for a nationwide presidential campaign to overemphasize heavily populated metro areas or ignore rural areas, we would see evidence of this in the way presidential campaigns are actually conducted today inside the closely divided battleground states.
Indeed, inside battleground states, every vote is already equal, and the winner is the candidate receiving the most popular votes.
Geography of Pennsylvania
Pennsylvania’s 12.7 million people are divided into two almost equal parts:[1]
● 6.4 million in the Philadelphia[2] and Pittsburgh[3] metro areas
● 6.3 million in the rest of the state (“The T”)[4]
2020 Campaign in Pennsylvania
Pennsylvania was a closely divided “battleground” state in 2020. In fact, it received more general-election campaign events[5] than any other state (45 of 212). These 45 events were divided almost exactly in proportion to population between the two halves of the state.
● 23 events in the Philadelphia and Pittsburgh metro areas
● 22 events in “The T”
The Democratic ticket won Pennsylvania in 2020 by a 50.6%–49.4% margin.
In 2020, the Democratic ticket won the Philadelphia and Pittsburgh metro areas by a 60%–40% margin, while the Republican ticket won “The T” by an almost identical 62%–38% margin. That is, politically, the two halves of the state are mirror images of each other.
|
|
Republican |
Democratic |
|
2 biggest metro areas |
40.4% |
59.6% |
|
The T |
61.8% |
38.2% |
|
Total |
49.4% |
50.6% |
In 2020, there were 22 Republican events (Trump, Pence) and 25 Democratic events (Biden, Harris). Each ticket devoted slightly more attention to the areas where it had highest support—with an overall result that the two biggest metro areas and “The T” received almost exactly the same overall amount of attention.
|
|
Republican |
Democratic |
Total |
|
2 biggest metro areas |
8 |
15 |
23 |
|
The T |
12 |
10 |
22 |
|
Total |
20 |
25 |
45 |
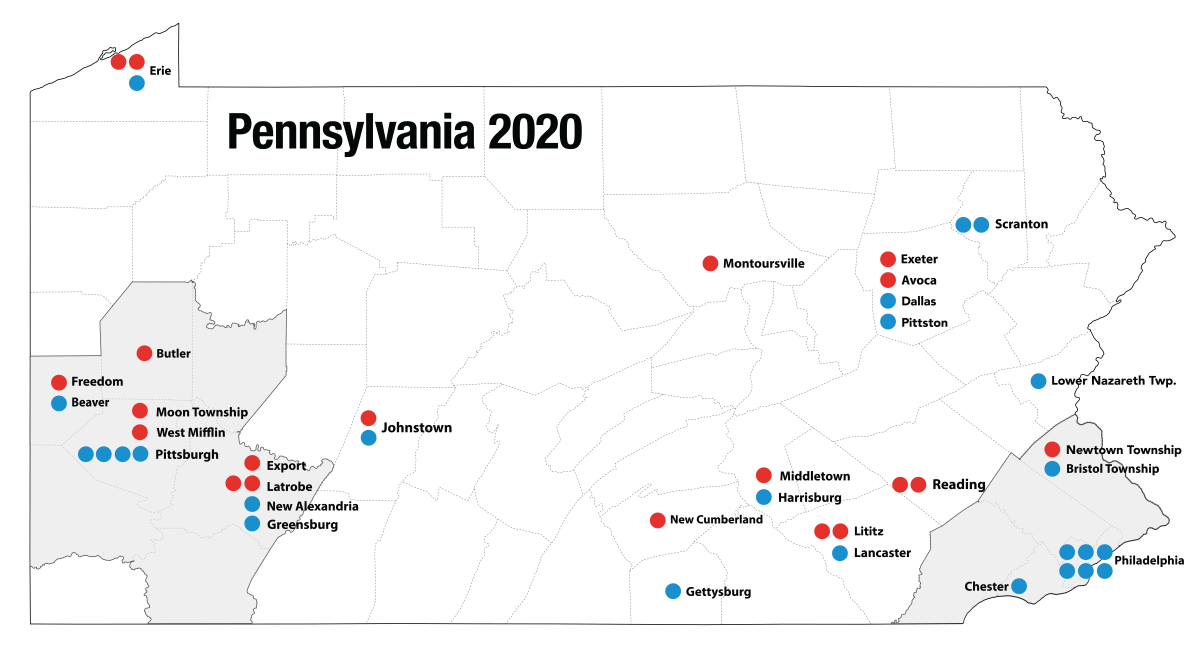
The location of Pennsylvania’s 45 campaign events in 2020 are shown in the map and table below. As can be seen, there is a mix of small towns, middle-sized places, and big cities.
Location of Pennsylvania’s 45 Campaign Events in 2020
|
Place |
Population |
Candidate and date of campaign event |
County |
|
New Alexandria |
560 |
Biden 9/30 |
Westmoreland |
|
Export |
917 |
Pence 9/9 |
Westmoreland |
|
Freedom |
1,569 |
Pence 9/9 |
Beaver |
|
Avoca |
2,661 |
Trump 11/2 |
Luzerne |
|
Beaver |
4,531 |
Biden 11/2 |
Beaver |
|
Montoursville |
4,615 |
Trump 10/31 |
Lycoming |
|
Lower Nazareth Twp. |
5,674 |
Harris 11/2 |
Northampton |
|
Exeter |
5,652 |
Pence 9/1 |
Luzerne |
|
New Cumberland |
7,277 |
Pence 10/19 |
Cumberland |
|
Gettysburg |
7,620 |
Biden 10/6 |
Adams |
|
Pittston |
7,739 |
Harris 11/2 |
Luzerne |
|
Latrobe |
8,338 |
Pence 11/2; Trump 9/3 |
Westmoreland |
|
Dallas |
8,994 |
Biden 10/24 |
Luzerne |
|
Middletown |
8,901 |
Trump 9/26 |
Dauphin |
|
Lititz |
9,369 |
Pence 9/29, Trump 10/26 |
Lancaster |
|
Butler |
13,757 |
Trump 10/31 |
Butler |
|
Greensburg |
14,892 |
Biden 9/30 |
Westmoreland |
|
Newtown Twp. |
19,299 |
Trump 10/31 |
Bucks |
|
West Mifflin |
20,313 |
Pence 10/23 |
Allegheny |
|
Johnstown |
20,978 |
Biden 9/30, Trump 10/13 |
Cambria |
|
Moon Twp. |
24,185 |
Trump 9/22 |
Allegheny |
|
Chester |
33,972 |
Biden 10/26 |
Delaware |
|
Harrisburg |
49,528 |
Biden 9/7 |
Dauphin |
|
Bristol Twp. |
54,582 |
Biden 10/24 |
Bucks |
|
Lancaster |
59,322 |
Biden 9/7 |
Lancaster |
|
Scranton |
76,089 |
Biden 9/17, 11/3 |
Lackawanna |
|
Reading |
88,082 |
Pence 10/17, Trump 10/31 |
Berks |
|
Erie |
101,786 |
Biden 10/10, Trump 10/20, Pence 11/2 |
Erie |
|
Pittsburgh |
305,704 |
Biden 8/31, 9/30, 11/2, 11/2 |
Allegheny |
|
Philadelphia |
1,526,006 |
Harris (9/17, 11/2), Biden (10/15, 11/1, 11/1, 11/3) |
Philadelphia |
2016 Campaign in Pennsylvania
Pennsylvania was a closely divided “battleground” state in 2016. It received 54 of the nation’s 399 general-election campaign events.
These 54 events were divided almost exactly in proportion to population between the two halves of the state.
● 28 events in in the Philadelphia and Pittsburgh metro areas
● 26 events in “The T”
In 2016, the Democratic ticket won the Philadelphia and Pittsburgh metro areas by a 60%–40% margin, while the Republican ticket won “The T” by 62%–38%. Overall, the Republican ticket won the state in 2016 by a 50.4%–49.6% margin.
|
|
Republican |
Democratic |
|
2 biggest metro areas |
40.4% |
59.6% |
|
The T |
61.8% |
38.2% |
|
Total |
50.4% |
49.6% |
In 2016, there were 28 Republican events (Trump, Pence) and 26 Democratic events (Clinton, Kaine). Each ticket devoted slightly more attention to the areas where it had highest support—with an overall result that the two biggest metro areas and “The T” received almost exactly the same overall amount of attention.
|
|
|
Republican |
Democratic |
Total |
|
|
2 biggest metro areas |
11 |
17 |
28 |
|
|
The T |
17 |
9 |
26 |
|
|
Total |
28 |
26 |
54 |
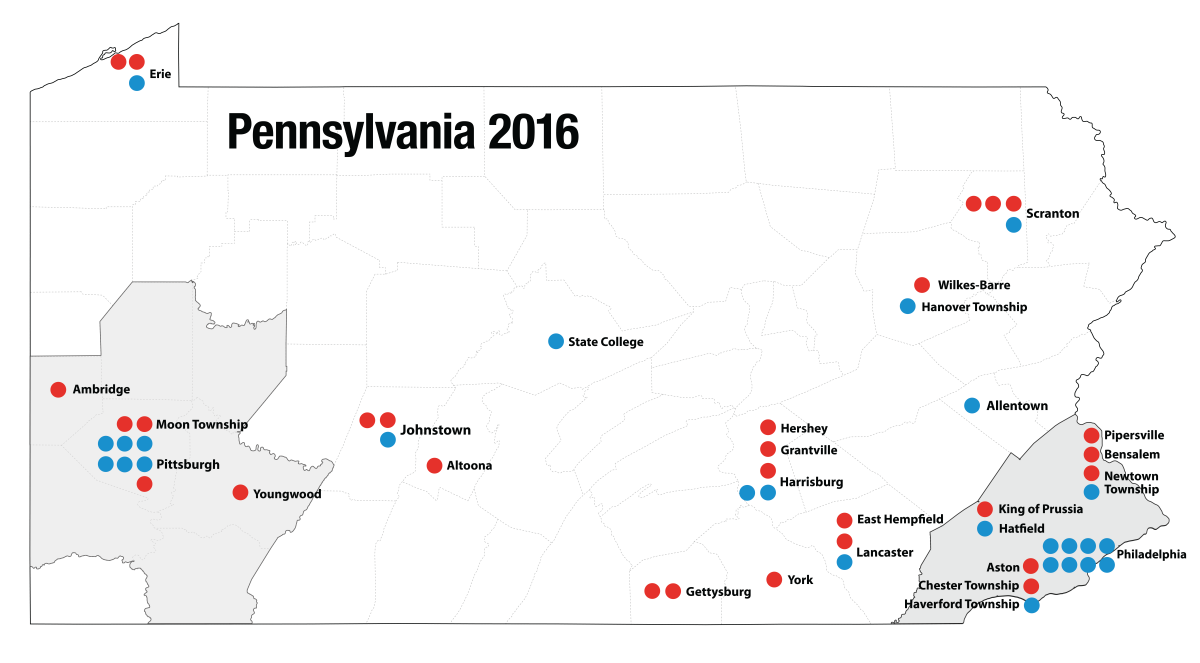
The locations of Pennsylvania’s 54 general-election campaign events in 2016 are shown in the table and map below.
As can be seen, there is a mix of small towns, middle-sized places, and big cities.
Location of Pennsylvania’s 54 Campaign Events in 2016
|
Place |
Population |
Candidate and date of campaign event |
County |
CD |
|
Youngwood |
3,050 |
Pence (11/1) |
Westmoreland |
18 |
|
Grantville |
3,581 |
Pence (10/5) |
Dauphin |
11 |
|
Chester Twp. |
3,940 |
Trump (9/22) |
Delaware |
7 |
|
Pipersville |
6,212 |
Pence (8/23) |
Bucks |
8 |
|
Ambridge |
7,050 |
Trump (10/10) |
Beaver |
12 |
|
Gettysburg |
7,620 |
Pence (10/6), Trump (10/22) |
Adams |
4 |
|
Hanover Twp |
10,866 |
Kaine (8/31) |
Northampton |
15 |
|
Hershey |
14,257 |
Trump (11/4) |
Dauphin |
11 |
|
Aston |
16,592 |
Trump (9/13) |
Delaware |
7 |
|
Hatfield Twp |
17,249 |
Clinton-Kaine (7/29) |
Montgomery |
6 |
|
Newtown Twp |
19,299 |
Kaine (10/26), Trump (10/21) |
Bucks |
8 |
|
King of Prussia |
19,936 |
Pence (8/23) |
Montgomery |
7 |
|
Johnstown |
20,978 |
Clinton-Kaine (7/30), Pence (10/6), Trump (10/21) |
Cambria |
12 |
|
East Hempfield |
23,522 |
Trump (10/1) |
Lancaster |
16 |
|
Moon Twp |
24,185 |
Pence (11/3), Trump (11/6) |
Allegheny |
14 |
|
Wilkes-Barre |
41,498 |
Trump (10/10) |
Luzerne |
11 |
|
State College |
42,034 |
Kaine (10/21) |
Centre |
5 |
|
York |
43,718 |
Pence (9/29) |
York |
4 |
|
Altoona |
46,320 |
Trump (8/12) |
Blair |
9 |
|
Haverford Twp |
48,491 |
Clinton (10/4) |
Delaware |
7 |
|
Harrisburg |
49,528 |
Clinton (10/4), Clinton-Kaine (7/29), Trump (8/1) |
Dauphin |
11 |
|
Lancaster |
59,322 |
Pence (8/9), Kaine (8/30) |
Lancaster |
16 |
|
Bensalem |
60,427 |
Pence (10/28) |
Bucks |
8 |
|
Scranton |
76,089 |
Trump-Pence (7/27), Clinton (8/15), Pence (9/14), Trump (11/7) |
Lackawanna |
17 |
|
Erie |
101,786 |
Trump (8/12), Kaine (8/30), Pence (11/7) |
Erie |
3 |
|
Allentown |
118,032 |
Kaine (10/26) |
Lehigh |
15 |
|
Pittsburgh |
305,704 |
Clinton-Kaine (7/30, 10/22), Pence (8/9), Kaine (9/5, 10/6), Clinton (11/4, 11/7) |
Allegheny |
14 |
|
Philadelphia |
1,526,006 |
Clinton (8/16, 9/19, 11/5, 11/6, 11/7), Kaine (10/5), Clinton-Kaine (7/29, 10/22) |
Philadelphia |
2 |
2012 Campaign in Pennsylvania
The 2012 presidential campaign in Pennsylvania illustrates another important characteristic of the current state-by-state winner-take-all method of awarding electoral votes—namely that battleground status is fleeting and fickle.
The Democratic ticket was comfortably ahead in Pennsylvania in 2012. In fact, the Obama-Biden ticket ended up by winning Pennsylvania by 323,931 votes—a 54%–46% margin.
Under the current winner-take-all system, almost all general-election campaigning for President takes place in states where the major-party candidates are within less than eight percentage points of each other—that is, within a 54%–46% margin. Thus, in 2012, Pennsylvania was at the outer limit of states where presidential candidates bother to campaign.
Because polling showed that the Democratic ticket was comfortably ahead in Pennsylvania throughout 2012, the state received only five of the nation’s 253 general-election campaign events in 2012—compared to 54 events in 2016 (out of 399 nationally) and 45 events in 2020 (out of 212). That is, Pennsylvania received only about 1/10 of the attention in 2012 that it received in 2016 and 2020. The fact that Pennsylvania was “not on the map” in 2012 is further illustrated by the fact that neither President Obama nor Vice President Biden bothered to visit Pennsylvania.
As the campaign drew to a close, Governor Romney and Congressman Ryan made five visits to Pennsylvania—four at the very end of the campaign.
The locations of Pennsylvania’s five general-election campaign events—all Republican—in 2012 are shown in the table below.
Location of Pennsylvania’s 5 Campaign Events in 2012
|
Place |
Population |
Candidate and date of event |
County |
|
Morrisville |
8,728 |
Romney (11/4) |
Bucks |
|
Middletown |
45,436 |
Ryan (11/3) |
Dauphin |
|
Moon Twp. |
24,185 |
Ryan (10/20) |
Allegheny |
|
Wayne |
31,531 |
Romney (9/28) |
Delaware |
|
Pittsburgh |
305,704 |
Romney (11/6) |
Allegheny |
The fact that battleground status is fleeting and fickle is further illustrated by Michigan in 2012. Michigan received a large amount of attention in 2016 and 2020, but almost none in 2012. Michigan received 22 events in 2016 (out of 399 nationally) and 21 events in 2020 (out of 212). However, because polling showed that the Democratic ticket was comfortably ahead in Michigan throughout 2012, President Obama, Vice President Biden, and Republican presidential nominee Mitt Romney did not bother to visit Michigan at all. The state received only one visit in 2012—from Republican vice-presidential nominee Paul Ryan. Meanwhile, neighboring Ohio (which has about the same population as Michigan) was closely divided in 2012, and it received 73 of the nation’s 253 general-election campaign events.
Click here for a PDF version of the above.
Click here for detailed discussion of similar data from other battleground states (chapter 8 of Every Vote Equal book)
[1] Pennsylvania has a population of 12,702,379, according to the 2010 census. The Philadelphia Metropolitan Statistical Area (MSA) and the Pittsburgh MSA had a combined population of 6,365,279 (50.1% of the total), while the remainder of the state had a population of 6,337,100 (49.9% of the total).
[2] The Philadelphia metropolitan statistical area (MSA) consists of five counties (Philadelphia county, Montgomery, Bucks, Delaware, and Chester).
[3] The Pittsburgh MSA consists of seven counties (Allegheny, Armstrong, Beaver. Butler, Fayette, Washington, and Westmoreland.
[4] The rest of the state consists of 55 counties.
[5] The 2020 general-election campaign for President started on August 28, 2020 (the day after the end of the Republican National Convention) and ended on Tuesday November 3, 2020 (Election Day).