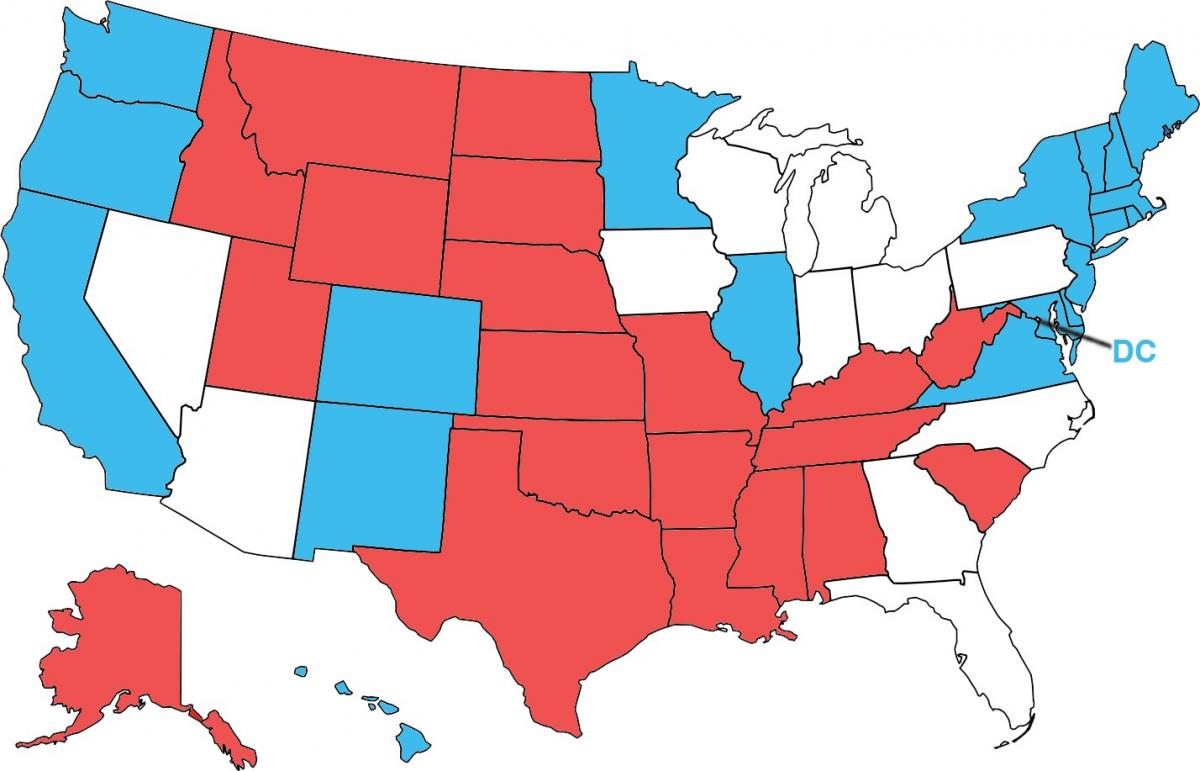
The map shows the 20 states that voted Republican and the 20 states that voted Democratic in the 5 presidential elections between 2008 and 2024.
The table shows the number of times that a particular place voted Democratic in the 5 presidential elections between 2008 and 2024.
|
5 times Democratic |
4 times Democratic |
3 times Democratic |
2 times Democratic |
1 time Democratic |
0 times Democratic |
|
20 places |
1 place |
4 places |
4 places |
4 places |
20 places |
|
CA (54) |
NV (6) |
MI (15) |
IA (6) |
AZ (11) |
AL (9) |
|
CO (10) |
|
PA (19) |
FL (30) |
GA (16) |
AK (3) |
|
CT (7) |
|
WI (10) |
OH (17) |
IN (11) |
AR (6) |
|
DE (3) |
|
NE-CD2 (1)** |
|
NC (16) |
ID (4) |
|
DC (3)* |
|
ME-CD2 (1)** |
|
|
KS (6) |
|
HI (4) |
|
|
|
|
KY (8) |
|
IL (19) |
|
|
|
|
LA (8) |
|
MA (11) |
|
|
|
|
MO (10) |
|
ME (3)** |
|
|
|
|
MS (6) |
|
MD (10) |
|
|
|
|
MT (4) |
|
MN (10) |
|
|
|
|
NE (4)** |
|
NH (4) |
|
|
|
|
ND (3) |
|
NJ (14) |
|
|
|
|
OK (7) |
|
NM (5) |
|
|
|
|
SC (9) |
|
NY (28) |
|
|
|
|
SD (3) |
|
OR (8) |
|
|
|
|
TN (11) |
|
RI (4) |
|
|
|
|
TX (40) |
|
VT (3) |
|
|
|
|
UT (6) |
|
VA (13) |
|
|
|
|
WY (3) |
|
WA (12) |
|
|
|
|
WV (4) |
|
225 EV |
6 EV |
46 EV |
53 EV |
54 EV |
154 EV |
Note that Maine and Nebraska award electoral votes by congressional district. Therefore, Maine’s 2nd congressional district and Nebraska’s 2nd congressional district (which have each recently voted differently from the state as a whole) are shown separately in this table. Thay are shown as “ME-CD2 (1)” and “NE-CD2 (1)”, respectively. Then, Maine’s remaining 3 non-competitive electoral votes are separately shown as “ME(3)”, and Nebraska’s remaining 4 non-competitive electoral votes are separately shown as “NE (4)”.
The District of Columbia is treated as a state in this table.
The last column of the table shows the number of electoral votes for the 2024 and 2028 elections. Some states had slightly different numbers of electoral votes in earlier elections.