- 9.36.1 MYTH: Population growth in Sunbelt states gives the Republicans an ongoing advantage in the Electoral College.
- 9.36.2 MYTH: The 2000 election illustrates the Republican Party’s structural advantage under the current system.
- 9.36.3 MYTH: The Republican Party would find it difficult to win the most votes nationwide.
- 9.36.4 MYTH: There is a systemic Republican or Democratic advantage in the Electoral College
9.36.1 MYTH: Population growth in Sunbelt states gives the Republicans an ongoing advantage in the Electoral College.
QUICK ANSWER:
● Each state’s number of votes in the Electoral College is readjusted every 10 years to reflect the result of the federal census.
● Republican-leaning states gained a total of 18 electoral votes as a result of the 2020 and 2010 census—largely because of rapid population growth in Sunbelt states.
● This gain of 18 electoral votes was illusory, because newcomers with political views different from a state’s existing voters often destabilize the state’s political equilibrium. In particular, there are eight states (comprising 107 electoral votes) that were solidly Republican for decades, but where fast growth did not benefit the Republican cause. Rapidly growing states such as Virginia, Colorado, and New Mexico were solidly red in presidential elections during the last part of the 20th century. However, they transitioned to being battleground states (for a few elections), and they are now solidly blue. Moreover, fast-growing Arizona, Florida, Georgia, Nevada, and North Carolina have shifted from being solidly red during the last part of the 20th century to being battleground states in the 21st century.
As a result of each recent census, many states that were solidly Republican for decades (mainly in the South and West) have grown rapidly.
These states have consistently gained electoral votes at the expense of other states (mainly in the North) that have usually voted Democratic.
Some have argued that this long-term shift of electoral votes should be interpreted as favoring the Republican Party.
However, rapid population growth is not necessarily advantageous to a state’s currently dominant political party.
People move into a state, leave a state, and stay in a state because of various economic, demographic, cultural, and psychological factors.
Because the political outlook of newcomers often differs significantly from that of continuing residents and leavers, rapid population growth often alters a state’s political complexion.
The 2010 and 2020 census gave Republicans an additional 18 electoral votes, but destabilized 77 other electoral votes.
Republican-leaning states gained six electoral votes as a result of the 2020 census and 12 electoral votes, thanks to the 2010 census.
The Republican Party would have received six more electoral votes in the 2020 presidential election if the allocation of electoral votes based on the 2020 census had applied to the 2020 election. Specifically:
- Five states that voted Democratic in the 2020 presidential election lost electoral votes as a result of the 2020 census, namely California (–1), Illinois (–1), Michigan (–1), New York (–1), and Pennsylvania (–1). However, two states that voted Democratic in 2020 gained electoral votes, namely Colorado (+1) and Oregon (+1). The result was a net gain of three electoral votes for the Republicans.
- Four states that voted Republican in the 2020 presidential election gained electoral vote(s) as a result of the 2020 census, namely Florida (+1), Montana (+1), North Carolina (+1), and Texas (+2). However, two states that voted Republican in 2020 lost electoral votes, namely Ohio (–1) and West Virginia (–1). The result was a net gain of three electoral votes for the Republicans.
The 2010 census had a similar effect, as indicated by the results of the 2008 and 2012 elections.[992]
- Eight states that voted Democratic in the 2008 and 2012 presidential elections lost electoral votes as a result of the 2010 census, namely Illinois (–1), Iowa (–1), Massachusetts (–1), Michigan (–1), New Jersey (–1), New York (–2), Ohio (–2), and Pennsylvania (–1). However, three states that voted Democratic in 2008 and 2012 gained electoral votes, namely Florida (+2), Nevada (+1), and Washington (+1). The result was a net gain of six electoral votes for the Republicans.
- Five states that voted Republican in the 2008 and 2012 presidential elections gained electoral vote(s) as a result of the 2010 census, namely Arizona (+1), Georgia (+1), South Carolina (+1), Utah (+1), and Texas (+4). However, two states that voted Republican in 2008 and 2012 lost electoral votes, namely Louisiana (–1) and Missouri (–1). The result was a net gain of six electoral votes for the Republicans.
This Republican gain of 12 electoral votes as a result of the 2010 census and the additional gain of six electoral votes as a result of the 2020 census might seem, at first glance, to be helpful to the Republicans.
However, this combined gain of 18 electoral votes was illusory, because it was accompanied by a destabilization of eight states with 107 electoral votes that had been solidly Republican during the last part of the 20th century and the early 2000s.
These eight formerly solidly Republican states are listed below along with their numbers of electoral votes in the 2024 and 2028 elections.
- Virginia (13), Colorado (10), and New Mexico (5) were solidly red for most of the last part of the 20th century. All three voted Republican for President in 2004. However, they transitioned to being solidly blue in presidential elections in 2008, 2012, 2016, and 2020. All three are considered blue states in 2024. These states together have 28 electoral votes.
- North Carolina (16), Arizona (11), Georgia (16), and Nevada (6) were solidly red for most of the last part of the 20th century. All four voted Republican for President in 2000 and 2004. However, they have transitioned to being closely divided battleground states in recent years. These states together have 49 electoral votes.
- Florida (30) was solidly red for most of the last part of the 20th century. However, it was a closely divided battleground state in 1996 (and, in fact, went Democratic that year) and in 2000 (when it went Republican by a mere 537 popular votes). It went Democratic in 2008 and 2012 and then went Republican in 2016 and 2020 (when Trump won 52% of the two-party vote).
Rapid population growth upset the previously prevailing political equilibrium in each of these eight states and then, more tangibly, increased the payoff to the Democrats when they won those states.
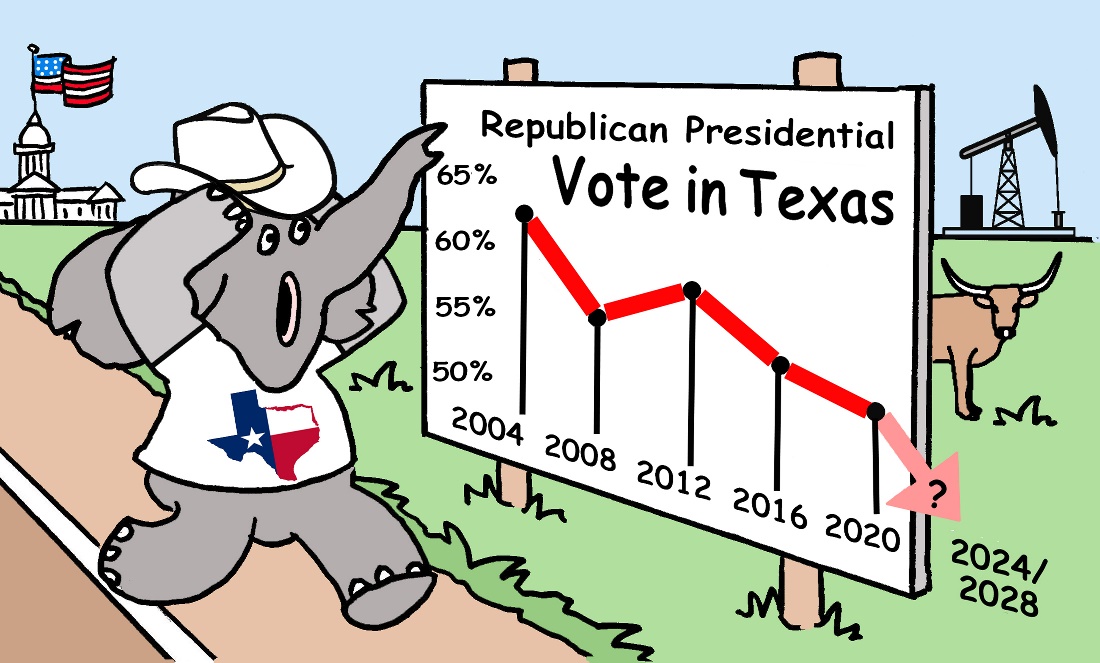
Moreover, rapid population growth in Texas creates the possibility of the nation’s second-largest state (with 40 electoral votes in the 2024 and 2028 elections) becoming a battleground state in the future.[993], [994]
Figure 9.28 shows that the Republican presidential nominee’s percentage of the two-party vote was:
- 62% in 2004 (when Texas had 34 electoral votes)
- 56% in 2008
- 58% in 2012 (when Texas had 38 electoral votes)
- 55% in 2016
- 53% in 2020.
Mike Flanagan—flantoons@btinternet.com
Footnotes
[992] See table 3.1 for the distribution of electoral votes in various decades.
[993] Mahtesian, Charles. Obama’s Texas battleground prediction. Politico. July 18, 2012.
[994] Hallman, Tristan. Obama: Texas will be a battleground state “soon.” Dallas Morning News. July 17, 2012. The quote from Obama was “You’re not considered one of the battleground states, although that’s going to be changing soon.”
9.36.2 MYTH: The 2000 election illustrates the Republican Party’s structural advantage under the current system.
QUICK ANSWER:
- The Republicans won the 2000 presidential election because of George W. Bush’s 537 popular-vote margin in Florida out of over five million votes cast there. That razor-thin statewide margin was the composite result of numerous extraordinarily small events that occurred during that campaign—not because of any Republican structural advantage conferred by the state-by-state winner-take-all method of awarding electoral votes.
It is sometimes argued that the Republican victory in the 2000 election is evidence that the Republican Party has a structural advantage under the current state-by-state winner-take-all system.
In 2000, George W. Bush won Florida by a margin of 537 popular votes out of 5,963,110 votes cast there.
Indeed, when an election is decided by a margin of 537 votes out of 5,963,110, numerous factors (large and small) necessarily affected the outcome.
As detailed in section 1.3.9, at least four extraordinarily small random events decided the outcome of the presidential race in Florida in 2000:
- the decision by one county official to use the butterfly ballot;
- rain in part of the state on Election Day;
- the use of punch card voting and the resulting hanging chads; and
- the choice of size for the U.S. House of Representatives made in 1911.
There is no way to say whether Al Gore would have become President had the 2000 campaign been conducted on the basis of the national popular vote.
What can be said with certainty is that the patterns of candidate travel and advertising in 2000 would have been entirely different under a national popular vote, because candidates would have solicited votes in every state. Candidates would not have concentrated their efforts so heavily on Florida or any other single state in a nationwide campaign. Almost all (92%) of the general-election campaign events (405 of 439) occurred in 20 states where the Republican percentage of the two-party vote was in the narrow nine-percentage-point range between 44% and 53%, as shown in table 1.19. In a nationwide campaign, the issues discussed would have been different because the candidates would have had to appeal to more than just the voters living in the closely divided states.
9.36.3 MYTH: The Republican Party would find it difficult to win the most votes nationwide.
QUICK ANSWER:
- Over a period of time, the United States has been an evenly divided country. The cumulative nationwide presidential vote in the 31 presidential elections between 1900 and 2020 was virtually tied—50.17% of the two-party vote going to the Republicans and 49.83% going to the Democrats.
Table 9.54 shows the national popular vote for President between 1900 and 2020 and the difference between the Republican and Democratic vote.[995]
Table 9.54 The national popular vote for President 1900–2020
| Election | Republican | Democrat | R margin | D margin | R–D margin |
| 1900 | 7,219,193 | 6,357,698 | 861,495 | 861,495 | |
| 1904 | 7,625,599 | 5,083,501 | 2,542,098 | 2,542,098 | |
| 1908 | 7,676,598 | 6,406,874 | 1,269,724 | 1,269,724 | |
| 1912 | 4,120,207 | 6,294,326 | 2,174,119 | -2,174,119 | |
| 1916 | 8,547,039 | 9,126,063 | 579,024 | -579,024 | |
| 1920 | 16,151,916 | 9,134,074 | 7,017,842 | 7,017,842 | |
| 1924 | 15,724,310 | 8,386,532 | 7,337,778 | 7,337,778 | |
| 1928 | 21,432,823 | 15,004,336 | 6,428,487 | 6,428,487 | |
| 1932 | 15,760,426 | 22,818,740 | 7,058,314 | -7,058,314 | |
| 1936 | 16,679,683 | 27,750,866 | 11,071,183 | -11,071,183 | |
| 1940 | 22,334,940 | 27,343,218 | 5,008,278 | -5,008,278 | |
| 1944 | 22,021,053 | 25,612,610 | 3,591,557 | -3,591,557 | |
| 1948 | 21,970,064 | 24,105,810 | 2,135,746 | -2,135,746 | |
| 1952 | 33,777,945 | 27,314,992 | 6,462,953 | 6,462,953 | |
| 1956 | 35,590,472 | 26,022,752 | 9,567,720 | 9,567,720 | |
| 1960 | 34,108,157 | 34,226,731 | 118,574 | -118,574 | |
| 1964 | 27,178,188 | 43,129,566 | 15,951,378 | -15,951,378 | |
| 1968 | 31,785,480 | 31,275,166 | 510,314 | 510,314 | |
| 1972 | 47,169,911 | 29,170,383 | 17,999,528 | 17,999,528 | |
| 1976 | 39,147,793 | 40,830,763 | 1,682,970 | -1,682,970 | |
| 1980 | 43,904,153 | 35,483,883 | 8,420,270 | 8,420,270 | |
| 1984 | 54,455,075 | 37,577,185 | 16,877,890 | 16,877,890 | |
| 1988 | 48,886,097 | 41,809,074 | 7,077,023 | 7,077,023 | |
| 1992 | 39,103,882 | 44,909,326 | 5,805,444 | -5,805,444 | |
| 1996 | 39,198,755 | 47,402,357 | 8,203,602 | -8,203,602 | |
| 2000 | 50,460,110 | 51,003,926 | 543,816 | -543,816 | |
| 2004 | 62,040,611 | 59,028,432 | 3,012,179 | 3,012,179 | |
| 2008 | 59,934,814 | 69,456,898 | 9,522,084 | -9,522,084 | |
| 2012 | 60,930,782 | 65,897,727 | 4,966,945 | -4,966,945 | |
| 2016 | 62,985,134 | 65,853,652 | 2,868,518 | -2,868,518 | |
| 2020 | 74,215,875 | 81,268,586 | 7,052,711 | -7,052,711 | |
| Total | 1,032,137,085 | 1,025,086,047 | 227,453 |
As can be seen from the table, the United States has been an evenly divided country over the course of time. The cumulative two-party national popular vote in the 31 presidential elections between 1900 and 2020 was:
- 50.17% for the Republicans votes and
- 49.83% for the Democrats.
The results were similarly close for other periods.
If the Roosevelt-Hoover race is viewed as the start of the modern political era, the cumulative national popular vote for the two major parties between 1932 and 2020 was:
- 943,639,400 total Republicans votes—49.59%
- 959,292,643 total Democratic votes—50.41%.
If the 1960 Kennedy-Nixon race is viewed as the start of the modern political era, the cumulative national popular vote for the two major parties between 1960 and 2020 was:
- 775,504,817 total Republicans votes—49.91%
- 778,323,655 total Democratic votes—50.09%.
Between 1988 and 2020, the United States has been in an era of non-landslide presidential elections—that is, elections in which the popular vote difference between the two leading candidates was less than 10%. The cumulative national popular vote for the two major parties between 1988 and 2020 was:
- 497,756,060 total Republicans votes—48.59%
- 526,629,978 total Democratic votes—51.41%.
Footnotes
[995] In 1912, the Republican Party was badly split. The official Republican nominee (incumbent President William Howard Taft) came in third place nationally in both the popular and electoral votes—behind former Republican President Theodore Roosevelt, who ran as the nominee of the Progressive (Bull Moose) Party. Accordingly, this table shows Theodore Roosevelt’s vote in the Republican column for 1912, instead of Taft’s (smaller) vote.
9.36.4 MYTH: There is a systemic Republican or Democratic advantage in the Electoral College
QUICK ANSWER:
- Because the Republicans won five of the six presidential elections between 1968 and 1988 and numerous states had repeatedly voted for the Republican presidential nominee in that period, an argument (attributed to Horace Busby) became prevalent during the 1980s that the there was a “Republican Electoral College lock” on the presidency.
- Because numerous states had repeatedly voted for the Democratic presidential nominee between 1992 and 2012, an argument (attributed to Ronald Brownstein) became prevalent that the there was a durable Democratic “blue wall” in the Electoral College.
- The conventional wisdom prior to the 2016 election was that the Electoral College favored the Democrats.
- After Donald Trump was elected President in 2016 while losing the national popular vote, the conventional wisdom changed overnight and became that the Electoral College favored the Republicans.
The “Republican Electoral College lock” theory of the 1980s
The Republicans won five of the six presidential elections between 1968 and 1988.
The Republican percentage lead in the national popular vote was substantial in four of these elections—23 percentage points in 1972, 10 in 1980, 18 in 1984, and eight in 1988.
In 1988, a New York Times editorial referred to the Republican’s “Electoral College lock.”
“This year’s fashionable formula goes something like this: … The Republicans have a virtual ‘lock’ on the Electoral College.”
“The political analyst credited with the ‘lock’ theory is Horace Busby. … Busby concluded that ‘the Electoral College … is a Republican institution.’ He argued that the addition of important Sunbelt states like Florida and Texas to traditional Republican power bases elsewhere provided a recipe for long-term G.O.P. rule.”
“Recent history seems to confirm a Republican tilt. In the last 5 elections, 23 states with 202 electoral votes have voted Republican every time. Thirteen more have voted Republican four times. In 1988, these 36 states would produce 354 electoral votes, far more than the 270 required for a majority.”[996]
A 1992 article in the New York Times described the Republican “Electoral College lock” as follows:
“From … observations of what was happening in 1980, Busby postulated a theory that Republicans have an electoral vote ‘lock’ that gives them an automatic advantage in presidential elections.”[997]
“The ‘lock,’ according to Busby, consists of 29 states with 289 electoral votes—270 are needed to elect a president—that have gone Republican at least 75 percent of the time in the last 32 years.”
“Dominance of the Sun Belt, where more and more of the votes and the people are, gave the [Republican] Party an enormous edge in winning the White House—what many analysts described as a lock on the Electoral College.”[998]
Shortly after the term “Republican Electoral College lock” came into widespread use in the 1980s, Bill Clinton was elected President in 1992.
The Democratic “blue wall” theory emerged in 2009.
Ronald Brownstein described the “durable” Democratic “blue wall” in 2009:
“Democrats since 1992 have methodically constructed the party’s largest and most durable Electoral College base in more than half a century. Call it the ‘blue wall.’”
“18 states and the District of Columbia have now voted for the Democratic nominee in at least the past five presidential elections.”
“[These] strong-holds … are worth a combined 248 Electoral College votes. That’s more than 90 percent of the 270 votes required to win the presidency.”
“GOP nominee John McCain did not finish within 10 percentage points of Obama in any of the 18 states (or Washington, D.C.).”
“The Democrats’ grip on such a large electoral bloc forced McCain into the situation that Democrats typically confronted while the Republicans won five of the six presidential elections between 1968 and 1988. Through those years, so many states solidly favored the GOP that analysts in both parties spoke of a Republican ‘lock’ on the Electoral College.”
“The Democrats' current electoral vote stronghold is larger than the Republican base was during the heyday of the GOP lock on the Electoral College.”[999]
The 2012 election results seemed to solidify the notion of the Democratic blue wall.
The 2012 election appeared to validate Brownstein’s “blue wall.”
Chris Cillizza wrote in December 2012:
“For months leading up to the 2012 election, we wrote about the clear electoral college advantage that President Obama enjoyed.”
“The 332 electoral votes that Obama won on Nov. 6 not only affirmed that edge but also raised the question of whether Democrats were in the midst of the sort of electoral college stranglehold that Republicans enjoyed during the 1980s.”
“If the 2016 Democratic nominee carried only the states that President Obama won by 4.5 points or more, he/she would end up with 272 electoral votes and a victory.”
“The electoral college math looks decidedly daunting for Republicans as they begin to prepare for 2016 and beyond.”[1000] [Emphasis added]
In 2012, Jonathan Bernstein wrote in Salon:
“The Electoral College now favors the Democrats.”[1001]
In 2015, Chris Cillizza confidently asserted in the Washington Post:
“No matter whom Republicans nominate to face Hillary Rodham Clinton in November 2016, that candidate will start at a disadvantage. It’s not polling, Clinton’s deep résumé or the improving state of the economy. It’s the electoral college.
“Yes, the somewhat arcane—yet remarkably durable—way in which presidential elections are decided tilts toward Democrats in 2016, as documented by nonpartisan political handicapper Nathan Gonzales in a recent edition of the Rothenberg & Gonzales Political Report.”
“Gonzales’s analysis … reaffirms one of the most important—and undercovered—story lines in presidential politics in the past decade: the increasing Democratic dominance in the electoral college.”[1002], [1003][Emphasis added]
In June 2016, Shane Goldmacher and Annie Karni wrote in Politico:
“Hillary Clinton’s super PAC has begun spending $145 million on ads in eight states through November—and there’s a realistic path for her to win the White House even if she carries only one of them. It’s a sign of how strongly tilted the Electoral College map is in Clinton’s favor.”[1004] [Emphasis added]
The two-percentage-point Democratic advantage in the Electoral College in 2012 seemed to support the “blue wall” theory.
In 2012, Governor Mitt Romney received 60,930,782 popular votes nationally, compared to 65,897,727 popular votes for Barack Obama (as shown in the actual 2012 election returns found in table 1.10).
That is, Romney received about 48% of the two-party national popular vote—about two percentage points short.
Table 9.55 shows the results of applying a tie-producing uniform shift to actual 2012 election returns. This table will show that even if Romney had received enough additional voter support to create a tie in the national popular vote (preserving each candidate’s relative profile in each state), Obama would have won the Electoral College by 285–253.
- Column 2 shows Romney’s popular vote in each state after applying a uniform upward adjustment of 1.9581343% to his actual popular vote in the state. These upward adjustments add 2,483,472 votes to Romney’s nationwide total, giving him 63,414,254 votes.
- Column 3 shows Obama’s popular vote in each state after applying a uniform downward adjustment of 1.9581343% to his actual popular vote in the state. These downward adjustments subtract 2,483,472 votes from Obama’s nationwide total, giving him 63,414,255 votes. The result of these adjustments to the two candidates is to produce a near-tie in the national popular vote (that is, 63,414,254 to 63,414,255).
- Column 4 shows Romney’s percentage of the two-party vote in each state after his upward adjustment. That is, Romney has 50.00% of the nationwide vote after the adjustments. Note that Obama’s percentage of the two-party vote in each state (not shown in the table) is simply 100% minus Romney’s percentage in each state.
- Column 5 shows the Republican nominee’s popular vote margin in each state after his upward adjustment (if he is leading in the state).
- Column 6 shows the Democratic nominee’s popular vote margin in each state after his downward adjustment (if he is leading in the state).
- Columns 7 and 8 show the Republican and Democratic electoral votes, respectively, based on their adjusted number of popular votes.
The table is sorted according to Romney’s percentage in each state (column 4).
Table 9.55 Tie-producing uniform adjustment of 2012 election data
| State | Romney | Obama | R-percent | R-Margin | D-Margin | R-EV | D-EV |
| DC | 27,029 | 261,422 | 9.37% | 234,392 | 3 | ||
| HI | 129,389 | 298,284 | 30.25% | 168,894 | 4 | ||
| VT | 98,415 | 193,522 | 33.71% | 95,108 | 3 | ||
| NY | 2,621,665 | 4,335,638 | 37.68% | 1,713,972 | 29 | ||
| RI | 165,759 | 271,122 | 37.94% | 105,364 | 4 | ||
| MD | 1,023,754 | 1,625,959 | 38.64% | 602,205 | 10 | ||
| CA | 5,088,528 | 7,605,715 | 40.09% | 2,517,186 | 55 | ||
| MA | 1,249,204 | 1,860,400 | 40.17% | 611,196 | 11 | ||
| DE | 173,475 | 234,593 | 42.51% | 61,119 | 3 | ||
| NJ | 1,548,598 | 2,052,276 | 43.01% | 503,678 | 14 | ||
| CT | 665,047 | 874,928 | 43.19% | 209,881 | 7 | ||
| IL | 2,236,152 | 2,918,576 | 43.38% | 682,423 | 20 | ||
| ME | 305,857 | 387,725 | 44.10% | 81,867 | 4 | ||
| WA | 1,350,316 | 1,695,750 | 44.33% | 345,434 | 12 | ||
| OR | 787,946 | 936,717 | 45.69% | 148,771 | 7 | ||
| NM | 350,496 | 400,627 | 46.66% | 50,131 | 5 | ||
| MI | 2,206,893 | 2,472,932 | 47.16% | 266,038 | 16 | ||
| MN | 1,376,353 | 1,490,039 | 48.02% | 113,686 | 10 | ||
| WI | 1,470,336 | 1,561,615 | 48.49% | 91,280 | 10 | ||
| NV | 483,049 | 511,891 | 48.55% | 28,841 | 6 | ||
| IA | 761,030 | 792,131 | 49.00% | 31,101 | 6 | ||
| NH | 343,615 | 355,864 | 49.12% | 12,250 | 4 | ||
| CO | 1,234,161 | 1,273,887 | 49.21% | 39,726 | 9 | ||
| PA | 2,791,474 | 2,879,234 | 49.23% | 87,760 | 20 | ||
| VA | 1,896,820 | 1,897,522 | 49.99% | 701 | 13 | ||
| OH | 2,768,890 | 2,720,138 | 50.44% | 48,751 | 18 | ||
| FL | 4,326,791 | 4,071,515 | 51.52% | 255,276 | 29 | ||
| NC | 2,357,508 | 2,091,278 | 52.99% | 266,230 | 15 | ||
| GA | 2,154,125 | 1,698,390 | 55.91% | 455,736 | 16 | ||
| AZ | 1,277,886 | 981,000 | 56.57% | 296,886 | 11 | ||
| MO | 1,535,432 | 1,170,804 | 56.74% | 364,627 | 10 | ||
| IN | 1,470,934 | 1,102,496 | 57.16% | 368,438 | 11 | ||
| SC | 1,109,586 | 828,000 | 57.27% | 281,585 | 9 | ||
| MS | 735,687 | 538,008 | 57.76% | 197,678 | 6 | ||
| MT | 277,127 | 192,640 | 58.99% | 84,486 | 3 | ||
| AK | 170,302 | 117,014 | 59.27% | 53,288 | 3 | ||
| TX | 4,724,104 | 3,153,863 | 59.97% | 1,570,241 | 38 | ||
| LA | 1,190,669 | 770,734 | 60.70% | 419,935 | 8 | ||
| SD | 217,574 | 138,075 | 61.18% | 79,499 | 3 | ||
| ND | 194,455 | 118,831 | 62.07% | 75,623 | 3 | ||
| TN | 1,509,776 | 913,263 | 62.31% | 596,514 | 11 | ||
| KS | 714,827 | 418,533 | 63.07% | 296,293 | 6 | ||
| NE | 490,282 | 286,863 | 63.09% | 203,418 | 5 | ||
| AL | 1,296,098 | 755,523 | 63.17% | 540,576 | 9 | ||
| KY | 1,121,782 | 644,778 | 63.50% | 477,003 | 8 | ||
| AR | 668,151 | 374,002 | 64.11% | 294,149 | 6 | ||
| WV | 430,426 | 225,388 | 65.63% | 205,037 | 5 | ||
| ID | 433,320 | 200,378 | 68.38% | 232,941 | 4 | ||
| OK | 917,464 | 417,408 | 68.73% | 500,055 | 7 | ||
| WY | 175,666 | 64,582 | 73.12% | 111,085 | 3 | ||
| UT | 760,033 | 232,380 | 76.58% | 527,653 | 6 | ||
| Total | 63,414,254 | 63,414,255 | 50.00% | 253 | 285 |
The result of the tie-producing uniform adjustment shown in table 9.55 is that President Obama would lose Florida (29 electoral votes) and Ohio (18 electoral votes). However, even after losing these two states, Obama would have ended up with a 285–253 lead in the Electoral College.
Thus, even if Romney had received enough additional voter support to create a tie in the national popular vote, Obama would still have ended up with a lead of 28 electoral votes.[1005]
The 2016 election revived the belief that the Electoral College favors the Republican Party.
Since the 2016 election, the conventional wisdom has been that the Electoral College favors the Republicans.
A week before the June 27, 2024, debate between President Joe Biden and former President Donald Trump, Jason Willick wrote in the Washington Post:
“The Trump-Biden rematch is too close (40.8 percent to 40.3 percent in the FiveThirtyEight polling average on Wednesday) to handicap with confidence, and too frozen (Trump’s barely statistically significant lead has held for months) to deliver much horse-race drama.”
“Some unexpected things could happen after the polls close in November.”
“The first is the possibility that Trump ekes out the most votes—and loses the presidency. Yes, it’s unlikely. … But the winner-take-all electoral college is a fickle institution. It tilted toward Democrats in 2012, only to deliver the presidency to Trump in 2016, despite Hillary Clinton’s popular-vote plurality.”[1006] [Emphasis added]
Footnotes
[996] New York Times editorial. 1988. Opinion: The Electoral College's Cold Calculus. New York Times. July 8, 1988. https://www.nytimes.com/1988/07/08/opinion/the-electoral-college-s-cold-calculus.html
[997] Sawislak, Arnold. 1982. Horace Busby; NEWLN:Electoral locks and political music. United Press International. December 29, 1982. https://www.upi.com/Archives/1982/12/29/Horace-BusbyNEWLNElectoral-locks-and-political-music/6858409986000/
[998] Toner, Robin. 1992. Republicans’ ‘Electoral Lock’ Is Looking Much Less Secure. New York Times. August 3, 1992. https://www.nytimes.com/1992/08/03/us/1992-campaign-political-memo-republicans-electoral-lock-looking-much-less-secure.html
[999] Brownstein, Ronald. 2009. Dems find electoral safety behind a wall of blue. National Journal Magazine. January 17, 2009.
[1000] Cillizza, Chris. 2012. Democrats’ electoral college edge—in 1 amazing chart. Washington Post. December 10, 2012. http://www.washingtonpost.com/blogs/the-fix/wp/2012/12/10/democrats-electoral-college-edge-in-1-amazing-chart/
[1001] Bernstein, Jonathan. 2012. Do Democrats have a permanent Electoral College advantage? Nominate Jeb Bush or Bobby Jindal. It doesn’t matter: The Electoral College now favors the Democrats. Salon. December 1, 2012. http://www.salon.com/2012/12/01/do_democrats_have_a_permanent_electoral_college_advantage/
[1002] Cillizza, Chris. 2015. In 2016 race, an electoral college edge for Democrats. Washington Post. March 15, 2015. https://www.washingtonpost.com/politics/in-2016-race-an-electoral-college-edge-for-democrats/2015/03/15/855f2792-cb3c-11e4-a2a7-9517a3a70506_story.html
[1003] Cillizza, Chris. 2012. Democrats’ electoral college edge—in 1 amazing chart. Washington Post. December 10, 2012. https://www.washingtonpost.com/news/the-fix/wp/2012/12/10/democrats-electoral-college-edge-in-1-amazing-chart
[1004] Goldmacher, Shane and Karni, Annie. 2016. Hillary Clinton’s path to victory. Politico. June 19, 2016. https://www.politico.com/story/2016/06/hillary-clinton-path-victory-224228#ixzz4C1kM5TAf
[1005] Note that the table shows that Obama’s lead in Virginia (13 electoral votes) shrinks to a razor-thin 701 votes (1,897,522 to 1,896,820). However, even if Romney had won Virginia, Obama would have had a 272–266 lead in the Electoral College.
[1006] Willick, Jason. 2024. Three potential wild cards for a razor-close Biden-Trump election. Washington Post. June 20, 2024.