9.22.1 MYTH: National Popular Vote Is unpopular.
QUICK ANSWER:
- Polls conducted by different polling organizations over a number of years, using a variety of wordings of questions, all report high levels of support for a national popular vote.
Hans von Spakovsky of the Heritage Foundation has stated:
“National Popular Vote Inc., … one of California’s lesser-known advocacy organizations, want[s] to ‘scratch off’ the Electoral College—without getting the consent of the majority of Americans.”[433] [Emphasis added]
The National Popular Vote Compact would go into effect when enacted by states possessing a majority of the votes in the Electoral College.
Moreover, polls conducted by different polling organizations over a number of years, using a variety of wordings of questions, all report high levels of support for a national popular vote.
Pew Research Center’s multi-year nationwide poll
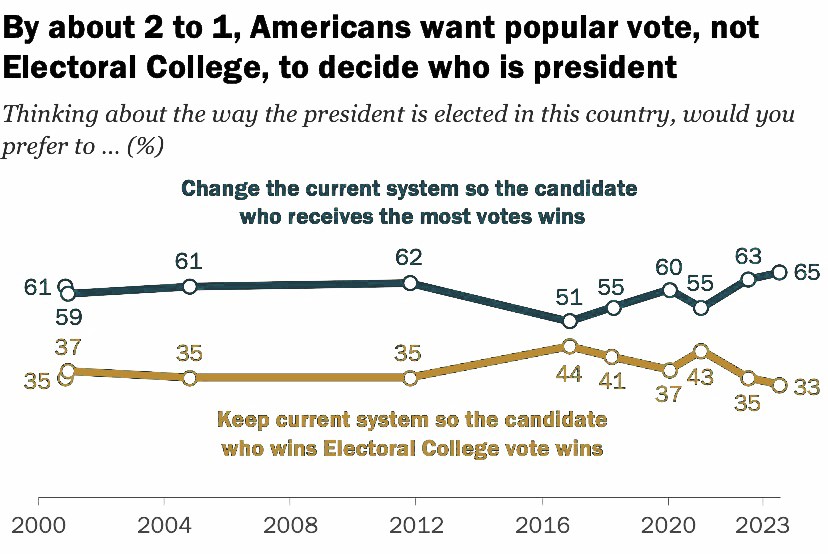
The Pew Research Center has conducted periodic polls since 2000 on the question of how the President should be elected.
According to its June 2023 poll:
“Nearly two-thirds of U.S. adults (65%) say the way the president is elected should be changed so that the winner of the popular vote nationwide wins the presidency.”[434]
Figure 9.10 shows the course of public opinion on this issue between 2000 and 2023.
»
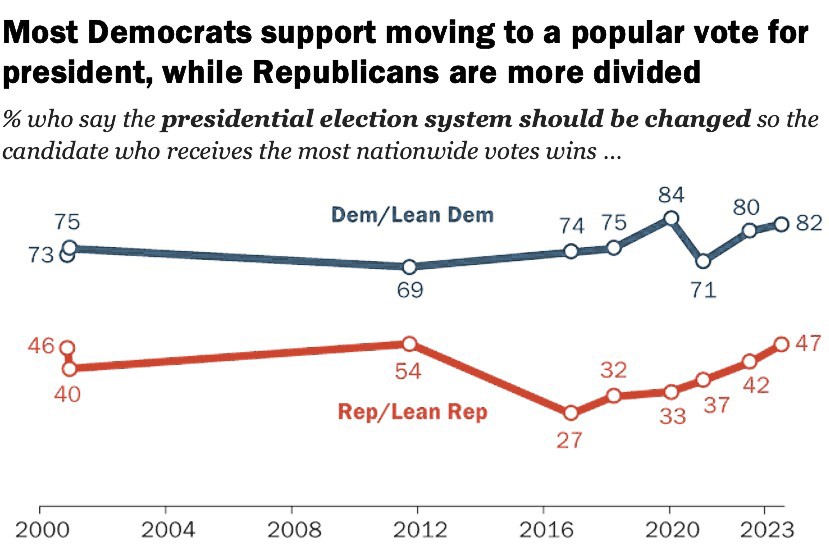
Concerning partisan support, the same June 2023 Pew poll showed:
“47% support moving to a popular vote system. GOP support for moving to a popular vote is the highest it’s been in recent years—up from 37% in 2021 and just 27% in the days following the 2016 election.”
Figure 9.11 shows the course of partisan views on this issue between 2000 and 2023.
The 2023 Pew report found that 63% of conservative Republicans favor the current system, while 63% of moderate and liberal Republicans support a national popular vote.
“A clear majority—63%—of conservative Republicans prefer keeping the current system, while 36% would change it. The balance of opinion reverses among moderate and liberal Republicans (who make up a much smaller share of the Republican coalition). A majority of moderate and liberal Republicans (63%) say they would back the country moving to a popular vote for president.”
Figure 9.12 shows the 2023 Pew results by ideology and party.

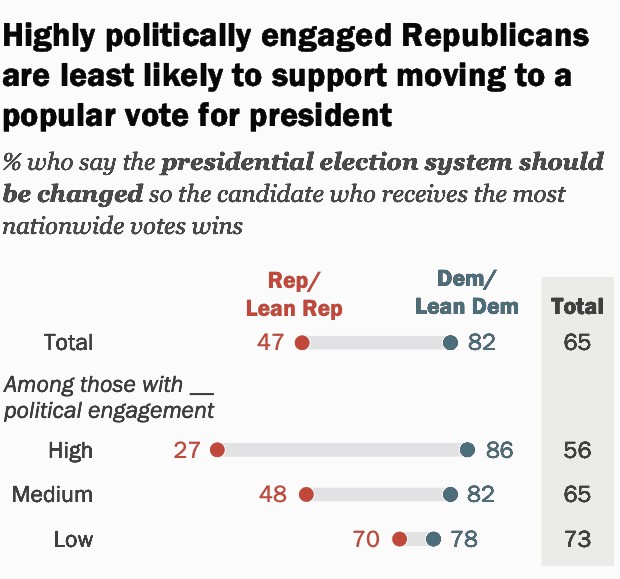
A person’s position on the issue varies with their degree of political engagement. The 2023 Pew report found:
“Political engagement—being interested in and paying attention to politics—is associated with views about the Electoral College, particularly among Republicans. Highly politically engaged Republicans overwhelmingly favor keeping the Electoral College: 72% say this, while 27% support moving to a popular vote system.”
Figure 9.13 shows the 2023 Pew results by ideology and party.
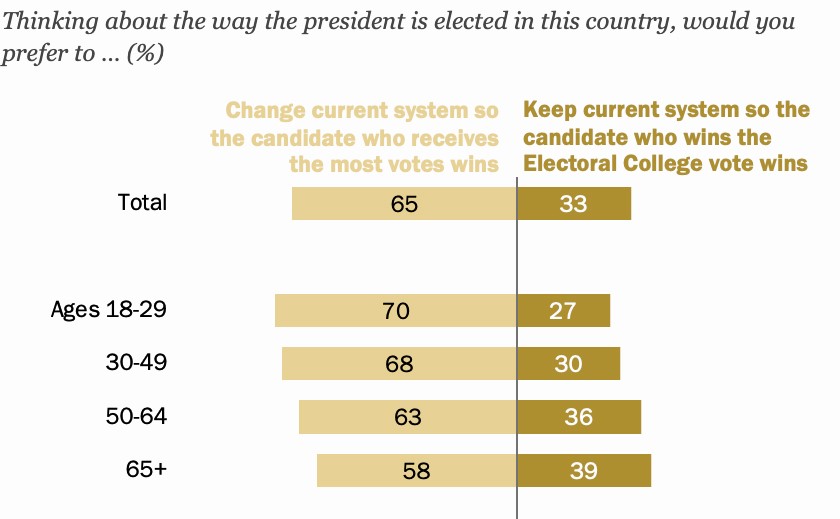
As to age, the 2023 Pew poll found:
“Younger adults are somewhat more supportive of changing the system than older adults. About seven-in-ten Americans under 50 (69%) support this. That share drops to about six-in-ten (58%) among those 65 and older.”
Figure 9.14 Pew 2023 poll results by age.
Nationwide polls starting in 1944
The public has strongly supported a nationwide popular election of the President for over six decades.
According to a Gallup report entitled “Americans Have Historically Favored Changing Way Presidents Are Elected,” the first nationwide poll on the topic of direct election of the President is believed to have been a 1944 Gallup poll that asked:
“It has been suggested that the electoral vote system be discontinued and Presidents of the United States be elected by total popular vote alone. Do you favor or oppose this proposal?”[435]
In the June 22–27, 1944, Gallup poll, 65% favored the proposal for a national popular vote for President; 23% disapproved; and 13% had no opinion.
In 1977 and 1980, the nationwide Gallup poll asked:
“Would you approve or disapprove of an amendment to the Constitution which would do away with the Electoral College and base the election of a President on the total vote cast throughout the nation?”[436]
In the January 14–17, 1977, Gallup poll, 73% approved of the proposed constitutional amendment for a national popular vote for President; 15% disapproved; and 12% had no opinion.
In the November 7–10, 1980, Gallup poll, 67% approved of the proposed constitutional amendment for a national popular vote for President; 19% disapproved; and 15% had no opinion.
The Gallup News Service has also reported:
“The greatest level of support, 81%, was recorded after the 1968 election when Richard Nixon defeated Hubert Humphrey in another extremely close election.”[437]
In 2007, the Washington Post, the Kaiser Family Foundation, and Harvard University conducted a nationwide poll that showed 72% support for direct nationwide election of the President.[438]
A 2010 nationwide poll prepared for the Aspen Institute by Penn Schoen Berland and released at the Aspen Ideas Festival found:
“74 percent agree it is time to abolish the Electoral College and have direct popular vote for the president.”[439]
State-level polls
State-level polls on the issue of a national popular vote for President have been conducted by a number of pollsters and organizations at various times.
In California in August 2007, Fairbank, Maslin, Maullin & Associates conducted a poll of 800 likely voters in California for Californians for the Fair Election Reform organization. Voters were asked about a:
“proposal [that] would guarantee that the presidential candidate who receives the most popular votes in all 50 states and the District of Columbia will win the presidency. Would you generally support or oppose switching to a system in which the presidency is decided by the actual votes in all 50 states combined?”
The results of this 2007 poll in California were that 69% would support a change to national popular vote; 21% would oppose the change; and 9% didn’t know.
In California in October 2008, the Public Policy Institute of California (PPIC) conducted a telephone survey of 2,004 Californians that asked:
“For future presidential elections, would you support or oppose changing to a system in which the president is elected by direct popular vote, instead of by the Electoral College?”[440]
The results of the 2008 PPIC poll in California were that 70% would support a change to a national popular vote; 21% would oppose the change; and 10% didn’t know.
In New York in October 2008, the Global Strategy Group conducted a poll on the National Popular Vote Compact and reported:
“Voters in New York are largely in favor of switching to a system that elects the President of the United States according to vote totals in all 50 states. Two-thirds of voters (66%) currently support the proposal, while just a quarter (26%) is in opposition to it. Support for the proposal is broad across demographics as a majority of each subgroup is in favor of it.”
Polls conducted by Public Policy Polling in various years for the National Popular Vote organization reported high levels of public support for a national popular vote for President in battleground states, spectator states, small states, southern states, border states, and elsewhere.
Table 9.37 shows the results, by party, from these polls.[441]
Table 9.37 Results, by party, from state-level polls
| State | Republican | Democratic | Other | Overall |
| Alaska | 66% | 78% | 69% | 70% |
| Arizona | 60% | 79% | 57% | 67% |
| Arkansas | 71% | 88% | 79% | 80% |
| California | 61% | 76% | 74% | 70% |
| Colorado | 56% | 79% | 70% | 68% |
| Connecticut | 67% | 80% | 71% | 74% |
| Delaware | 69% | 79% | 76% | 75% |
| D.C. | 48% | 80% | 74% | 76% |
| Florida | 68% | 88% | 76% | 78% |
| Idaho | 75% | 84% | 75% | 77% |
| Iowa | 63% | 82% | 77% | 75% |
| Kentucky | 71% | 88% | 70% | 80% |
| Maine | 70% | 85% | 73% | 77% |
| Massachusetts | 54% | 82% | 66% | 73% |
| Michigan | 68% | 78% | 73% | 73% |
| Minnesota | 69% | 84% | 68% | 75% |
| Mississippi | 75% | 79% | 75% | 77% |
| Montana | 67% | 80% | 70% | 72% |
| Nebraska | 62% | 78% | 63% | 67% |
| Nevada | 66% | 80% | 68% | 72% |
| New Hampshire | 57% | 80% | 69% | 69% |
| New Mexico | 64% | 84% | 68% | 76% |
| New York | 66% | 86% | 70% | 79% |
| Ohio | 65% | 81% | 61% | 70% |
| Oklahoma | 75% | 84% | 75% | 81% |
| Oregon | 70% | 82% | 72% | 76% |
| Pennsylvania | 68% | 87% | 76% | 78% |
| South Carolina | 64% | 81% | 68% | 71% |
| South Dakota | 67% | 84% | 75% | 75% |
| Utah | 66% | 82% | 75% | 70% |
| Vermont | 61% | 86% | 74% | 75% |
| Washington | 65% | 88% | 73% | 77% |
| West Virginia | 75% | 87% | 73% | 81% |
| Wisconsin | 63% | 81% | 67% | 71% |
| Wyoming | 66% | 77% | 72% | 69% |
| Average | 66% | 82% | 71% | 74% |
The poll in Nebraska is noteworthy because that state awards three of its five electoral votes by congressional district under a law first used in the 1992 election. In 2008, Barack Obama won Nebraska’s 2nd congressional district (the Omaha area), thereby winning one of the state’s electoral votes. In 2020, Joe Biden also won the 2nd district.
A survey of 977 Nebraska voters conducted on January 26–27, 2011, contained a comparative question about a national popular vote, Nebraska’s current congressional-district method, and the statewide winner-take-all method.
Voters were first asked:
“How do you think we should elect the President: Should it be the candidate who gets the most votes in all 50 states, or the current Electoral College system?”
The survey showed 67% overall support for a national popular vote for President. On this first question, support for a national popular vote by political affiliation was 78% among Democrats, 62% among Republicans, and 63% among others. By congressional district, support for a national popular vote was 65% in the 1st congressional district, 66% in the 2nd district (which voted for Obama in 2008), and 72% in the 3rd district. By gender, support for a national popular vote was 76% among women and 59% among men. By age, support for a national popular vote was 73% among 18–29-year-olds, 67% among 30–45 year-olds, 65% among 46–65 year-olds, and 69% among those older than 65. By race, support for a national popular vote was 68% among whites and 63% among others.
Voters were then asked to choose among three alternative methods of awarding Nebraska’s electoral votes:
- 16% favored a statewide winner-take-all method of awarding electoral votes;
- 27% favored Nebraska’s current congressional-district method of awarding electoral votes; and
- 57% favored a national popular vote.
Table 9.38 shows the results of this second question by political affiliation.
Table 9.38 Nebraska results, by political affiliation, on three alternative methods of electing the President.
| Method | Democrat | Republican | Other |
| Candidate who gets the most votes in all 50 states | 65% | 53% | 51% |
| Nebraska’s current district system | 26% | 27% | 32% |
| Statewide winner-take-all system | 9% | 20% | 17% |
Table 9.39 shows the results of this second question by congressional district. Note that the 2nd district was the district carried by Obama in 2008.
Table 9.39 Nebraska results, by political affiliation, on three alternative methods of electing the President.
| Method | First district | Second district | Third District |
| Candidate who gets the most votes in all 50 states | 53% | 58% | 59% |
| Nebraska’s current district system | 26% | 31% | 26% |
| Statewide winner-take-all system | 21% | 12% | 15% |
See section 9.37.1 for a discussion of polls in Utah, Connecticut, and South Dakota in which voters were asked a push question that highlighted the fact that the state’s electoral votes would be awarded to the winner of the national popular vote in all 50 states under the National Popular Vote Compact—rather than the winner of the statewide popular vote.
Footnotes
[433] Von Spakovsky, Hans. Protecting Electoral College from popular vote. Washington Times. October 26, 2011.
[434] Kiley, Joselyn. 2023. Majority of Americans continue to favor moving away from Electoral College. Pew Research Center. September 25, 2023. https://www.pewresearch.org/short-reads/2023/09/25/majority-of-americans-continue-to-favor-moving-away-from-electoral-college/
[435] Gallup News Service. 2000. Americans Have Historically Favored Changing Way Presidents Are Elected. November 10, 2000. Page 1. https://news.gallup.com/poll/2323/americans-historically-favored-changing-way-presidents-elected.aspx
[436] Ibid.
[437] Gallup News Service. 2000. Americans Have Historically Favored Changing Way Presidents Are Elected. November 10, 2000. Page 2. https://news.gallup.com/poll/2323/americans-historically-favored-changing-way-presidents-elected.aspx
[438] The Washington Post-Kaiser Family Foundation-Harvard University: Survey of Political Independents. 2007. Page 12. https://www.washingtonpost.com/wp-srv/politics/interactives/independents/post-kaiser-harvard-topline.pdf
[439] Time Aspen Ideas Festival 2011 full report. http://www.slideshare.net/PennSchoenBerland/time-aspen-ideas-festival-2011-full-report
[440] PPIC Statewide Survey: Californians and Their Government. October 2008.
[441] Cross-tabs and other details about these polls (and other polls) are available at https://www.nationalpopularvote.com/polls