9.7.1 MYTH: Presidential candidates will concentrate on the populous metropolitan areas in a national popular vote for President.
QUICK ANSWER:
- Under a national popular vote, every vote would be equal throughout the United States. A voter in a big metropolitan area would be no more influential or controlling than a voter anywhere else.
John W. York, a policy analyst at the Heritage Foundation, wrote in 2019:
“If the U.S. were to abandon the electoral college in favor of a national popular vote, the same few cities would be the focus of the battle for the White House every cycle. Given that they have limited time and money, presidential candidates of both parties would be foolish to waste their energy anywhere but the most densely populated urban centers. This is where the largest concentration of voters are, so racking up the votes in these areas would be the overwhelming focus of any election. Under a national popular vote, cities like Los Angeles and New York … would thoroughly and perpetually dominate electoral politics as well.”[282] [Emphasis added]
When every vote is equal, candidates for office know that they need to solicit voters throughout their entire constituency in order to win.
Contrary to what York says, presidential candidates would not be “foolish” to campaign throughout the entire electorate—they would be crazy not to.
In a national popular vote for President, a voter in a populous metro area would be no more valuable or important than a vote cast in a suburb, an exurb, a small town, or a rural area. Big metro areas would not receive all the attention or even a disproportionate amount of attention—much less control the outcome.
Perhaps the most convincing evidence for the fact that big metro areas do not control elections comes from looking at the way that presidential races are actually run inside today’s battleground states.
Inside a battleground state in a presidential election today, every vote is equal, and the winner is the candidate who receives the most popular votes in that state.
That is, the way to win everything that the battleground state has to offer (that is, all of its electoral votes) is identical to the way to win everything that the National Popular Vote Compact has to offer.
If there were any tendency for a nationwide presidential campaign to overemphasize heavily populated metro areas or ignore rural areas, we would see evidence of this tendency in the way presidential campaigns are actually conducted inside today’s closely divided states.
Let’s use Pennsylvania as an example.
Pennsylvania’s population of 12.7 million people is divided into two almost equal parts:[283]
- 6.4 million living in the Philadelphia[284] and Pittsburgh[285] metropolitan statistical areas and
- 6.3 million living in the rest of the state (often called “the T”).[286]
Pennsylvania was a closely divided “battleground” state in 2016. It received 54 of the nation’s 399 general-election campaign events.
Table 9.22 shows the locations of Pennsylvania’s 54 general-election campaign events in 2016. As can be seen, the campaigns visited a mix of small towns, middle-sized places, and big cities.
Table 9.22 Locations of Pennsylvania’s 54 events in 2016
| Place | Population | Campaign event | County | CD |
| Youngwood | 3,050 | Pence (11/1) | Westmoreland | 18 |
| Grantville | 3,581 | Pence (10/5) | Dauphin | 11 |
| Chester Twp. | 3,940 | Trump (9/22) | Delaware | 7 |
| Pipersville | 6,212 | Pence (8/23) | Bucks | 8 |
| Ambridge | 7,050 | Trump (10/10) | Beaver | 12 |
| Gettysburg | 7,620 | Pence (10/6), Trump (10/22) | Adams | 4 |
| Hanover Twp. | 10,866 | Kaine (8/31) | Northampton | 15 |
| Hershey | 14,257 | Trump (11/4) | Dauphin | 11 |
| Aston | 16,592 | Trump (9/13) | Delaware | 7 |
| Hatfield Twp. | 17,249 | Clinton-Kaine (7/29) | Montgomery | 6 |
| Newtown Twp. | 19,299 | Kaine (10/26), Trump (10/21) | Bucks | 8 |
| King of Prussia | 19,936 | Pence (8/23) | Montgomery | 7 |
| Johnstown | 20,978 | Clinton-Kaine (7/30), Pence (10/6), Trump (10/21) | Cambria | 12 |
| East Hempfield | 23,522 | Trump (10/1) | Lancaster | 16 |
| Moon Twp. | 24,185 | Pence (11/3), Trump (11/6) | Allegheny | 14 |
| Wilkes-Barre | 41,498 | Trump (10/10) | Luzerne | 11 |
| State College | 42,034 | Kaine (10/21) | Centre | 5 |
| York | 43,718 | Pence (9/29) | York | 4 |
| Altoona | 46,320 | Trump (8/12) | Blair | 9 |
| Haverford Twp. | 48,491 | Clinton (10/4) | Delaware | 7 |
| Harrisburg | 49,528 | Clinton (10/4), Clinton-Kaine (7/29), Trump (8/1) | Dauphin | 11 |
| Lancaster | 59,322 | Pence (8/9), Kaine (8/30) | Lancaster | 16 |
| Bensalem | 60,427 | Pence (10/28) | Bucks | 8 |
| Scranton | 76,089 | Trump-Pence (7/27), Clinton (8/15), Pence (9/14), Trump (11/7) | Lackawanna | 17 |
| Erie | 101,786 | Trump (8/12), Kaine (8/30), Pence (11/7) | Erie | 3 |
| Allentown | 118,032 | Kaine (10/26) | Lehigh | 15 |
| Pittsburgh | 305,704 | Clinton-Kaine (7/30, 10/22), Pence (8/9), Kaine (9/5, 10/6), Clinton (11/4, 11/7) | Allegheny | 14 |
| Philadelphia | 1,526,006 | Clinton (8/16, 9/19, 11/5, 11/6, 11/7), Kaine (10/5), Clinton-Kaine (7/29, 10/22) | Philadelphia | 2 |
Figure 9.6 is a map showing the locations of Pennsylvania’s 54 campaign events in 2016.
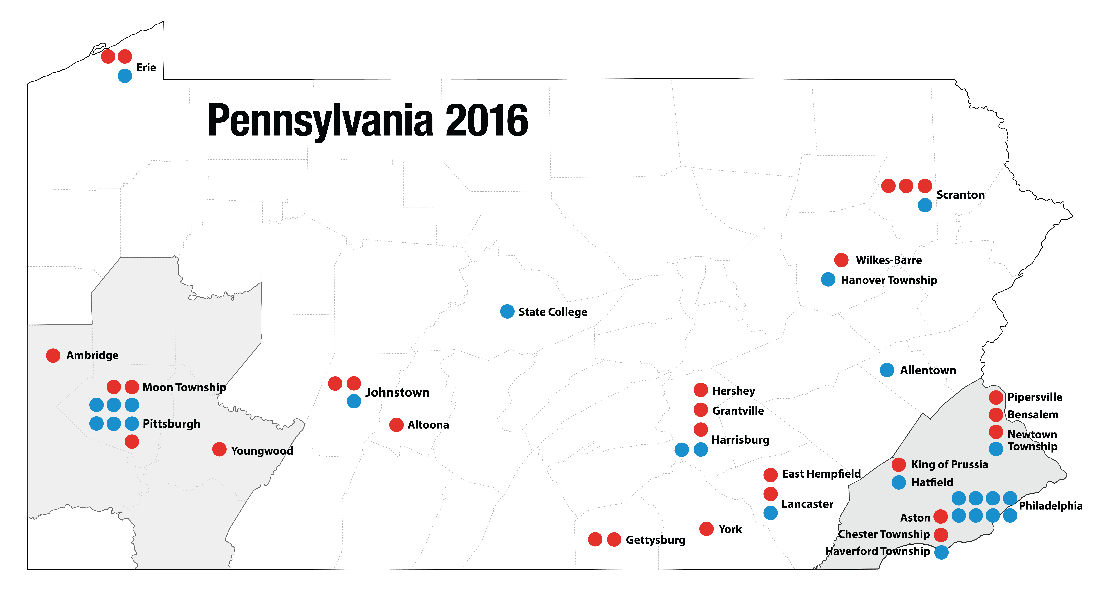
These 54 events were divided almost exactly in proportion to population between the two halves of the state.
- 28 events in the Philadelphia and Pittsburgh metro areas
- 26 events in “the T”
In 2016, the Democratic ticket won the Philadelphia and Pittsburgh metro areas by a 60%–40% margin, while the Republican ticket won “the T” by 62%–38%. Overall, the Republican ticket won the state in 2016 by a 50.4%–49.6% margin, as shown in table 9.23.
Table 9.23 Pennsylvania 2016 outcome
| Republican | Democratic | |
| 2 biggest metro areas | 40.4% | 59.6% |
| “The T” | 61.8% | 38.2% |
| Total | 50.4% | 49.6% |
In 2016, there were 28 Republican events (Trump, Pence) and 26 Democratic events (Clinton, Kaine). Each ticket devoted somewhat more attention to the parts of the state where it had highest support. However, taken together, the overall result is that the biggest metro areas and “the T” each received almost exactly the same overall amount of attention, as shown in table 9.24.
Table 9.24 Partisan breakdown of Pennsylvania’s 54 events in 2016
| Republican | Democratic | Total | |
| 2 biggest metro areas | 11 | 17 | 28 |
| The T | 17 | 9 | 26 |
| Total | 28 | 26 | 54 |
Chapter 8 provides additional information on the distribution of campaign events in the big metropolitan statistical areas of other battleground states versus the less populous parts of those same states.
Illogic of York’s concern about densely populated urban centers
One wonders why York expresses concern about the amount of attention received by the half of Pennsylvania’s population living in the state’s two biggest metro areas, but expresses no similar concern about the essentially equal amount of attention conferred on half of the state’s population living outside the biggest metro areas.
Moreover, there is nothing in the provisions of the U.S. Constitution that established the Electoral College and nothing in the state laws that enacted the winner-take-all system that makes any distinction between popular votes cast in “densely populated urban centers,” compared to votes cast elsewhere in the state.
2012 Campaign in Pennsylvania
The 2012 presidential campaign in Pennsylvania illustrates another important characteristic of the current state-by-state winner-take-all method of awarding electoral votes—namely that battleground status is fleeting and fickle.
The Democratic ticket was comfortably ahead in Pennsylvania in 2012. In fact, the Obama-Biden ticket ended up winning the state by 323,931 votes—a 54%–46% margin.
An eight percentage-point spread between the top two candidates is the outer boundary at which presidential campaigning usually occurs under the current winner-take-all system. In fact, almost all campaigning takes place in states where the top two candidates are within six percentage points of each other, and the vast majority of that campaigning occurs in states where the spread is considerably less than six percentage points.
Because polling showed that the Democratic ticket was comfortably ahead in Pennsylvania throughout 2012, Pennsylvania received only five of the nation’s 253 general-election campaign events in 2012—compared to 54 events in 2016 and 47 events in 2020. That is, Pennsylvania received only about one-tenth of the attention in 2012 that it received in 2016 and 2020.
Pennsylvania’s spectator status in 2012 was further evidenced by the fact that neither President Obama nor Vice President Biden bothered to make even one visit to Pennsylvania during the general-election campaign.
As the campaign drew to a close, Governor Romney and Congressman Ryan made five visits to Pennsylvania—four at the very end of the campaign.
The locations of Pennsylvania’s five general-election campaign events in 2012—all Republican—are shown in table 9.25.
Table 9.25 Locations of Pennsylvania’s five events in 2012
| Place | Population | Campaign event | County |
| Morrisville | 8,728 | Romney (11/4) | Bucks |
| Middletown | 45,436 | Ryan (11/3) | Dauphin |
| Moon Twp. | 24,185 | Ryan (10/20) | Allegheny |
| Wayne | 31,531 | Romney (9/28) | Delaware |
| Pittsburgh | 305,704 | Romney (11/6) | Allegheny |
Footnotes
[282] York, John W. 2019. No, the electoral college isn’t ‘electoral affirmative action’ for rural states. Los Angeles Times. October 9, 2019. https://www.latimes.com/opinion/story/2019-10-09/electoral-college-affirmative-action-rural-states
[283] Pennsylvania had a population of 12,702,379, according to the 2010 census. The Philadelphia Metropolitan Statistical Area (MSA) and the Pittsburgh MSA had a combined population of 6,365,279 (50.1% of the total), while the remainder of the state had a population of 6,337,100 (49.9% of the total).
[284] The Philadelphia metropolitan statistical area (MSA) consists of five counties (Philadelphia County, Montgomery, Bucks, Delaware, and Chester).
[285] The Pittsburgh MSA consists of seven counties (Allegheny, Armstrong, Beaver, Butler, Fayette, Washington, and Westmoreland).
[286] The rest of the state consists of 55 counties.