- 9.4.1 MYTH: Eleven states would control the outcome of a nationwide popular vote for President.
- 9.4.2 MYTH: California and New York would dominate a national popular vote for President.
- 9.4.3 MYTH: A candidate’s entire nationwide margin could come from just one state in a nationwide presidential election.
- 9.4.4 MYTH: Eleven colluding big states are trying to impose a national popular vote on the country.
9.4.1 MYTH: Eleven states would control the outcome of a nationwide popular vote for President.
QUICK ANSWER:
- Opponents of a nationwide vote for President sometimes claim that the voters of the 11 most populous states could alone elect a President. However, this criticism is based on the politically preposterous assumption that a particular presidential candidate would receive 100% of the popular vote in each of these 11 states (when, in fact, 54%–46% is the average margin by which the winning candidate wins the 11 most populous states).
- This criticism of a national popular vote has an even more serious flaw—it applies to the current system more than to a national popular vote. Under the current state-by-state winner-take-all method of awarding electoral votes, a candidate receiving a plurality of the popular votes in these same 11 states would win a majority of the Electoral College (and hence the presidency). That is, under the current system, a President could theoretically be elected with about 25% of the nationwide popular vote.
- In a national popular vote for President, every voter in every state would be equal throughout the United States. A vote cast in a populous state would be no more or less valuable than a vote cast anywhere else.
Hans von Spakovsky of the Heritage Foundation has stated that the National Popular Vote Compact:
“would give the most populous states a controlling majority of the Electoral College, letting the voters of as few as 11 states control the outcome of presidential elections.”[244] [Emphasis added]
A 2011 letter signed by House Speaker John Boehner (R–Ohio), Senator Mitch McConnell (R–Kentucky), and Governor Rick Perry (R–Texas) stated:
“The goal of this effort is clear: to put the fate of every presidential election in the hands of the voters in as few as 11 states and thus to give a handful of populous states a controlling majority of the Electoral College.”
Brian Mark Weber in The Patriot Post wrote in 2020:
“Think about it: Under NPV, a candidate could theoretically lose 39 states and still win the presidency.”[245]
It is true that the 11 biggest states possessed a majority of the electoral votes, according to the 2010 census.[246]
However, the voters of these 11 states alone could elect a President in a nationwide popular vote onlyif one makes the politically preposterous assumption that one candidate receives 100% of the popular vote from each of these 11 states.
The implausibility of this hypothetical scenario is demonstrated by the fact that no big state delivered more than 63% of its two-party popular vote to any candidate in the six presidential elections between 2000 and 2020 (as shown in table 9.7).
Table 9.7 Popular-vote percentage won by the winner of the 11 biggest states 2000–2020
| State | 2000 | 2004 | 2008 | 2012 | 2016 | 2020 |
| California | 53% | 54% | 61% | 60% | 61% | 63% |
| Texas | 59% | 61% | 56% | 57% | 52% | 52% |
| New York | 60% | 58% | 63% | 63% | 59% | 61% |
| Florida | 49% | 52% | 51% | 50% | 49% | 51% |
| Illinois | 55% | 55% | 62% | 57% | 55% | 57% |
| Pennsylvania | 51% | 51% | 55% | 52% | 48% | 50% |
| Ohio | 50% | 51% | 52% | 51% | 51% | 53% |
| Michigan | 51% | 51% | 57% | 54% | 47% | 51% |
| Georgia | 55% | 58% | 52% | 53% | 50% | 49% |
| New Jersey | 56% | 53% | 57% | 58% | 55% | 57% |
| North Carolina | 56% | 56% | 49% | 50% | 50% | 50% |
As can be seen in the table, the highest percentage is 63%, and there were only eight cases (out of 66 entries in the table) where the winning candidate won more than 60% of the vote.
More importantly, the average of the entries in the table is 54%.
Note also that many of the percentages in the table are close to 50%, because many of the biggest states were battleground states in one or more elections.[247]
Von Spakovsky’s criticism of the National Popular Vote Compact has an even more serious flaw—it applies to the current system more than to a national popular vote.
Anyone who is concerned about the possibility that the 11 most populous states might alone control the outcome of a national popular vote by voting unanimously for one candidate should be considerably more agitated about the current state-by-state winner-take-all method of awarding electoral votes.
The current system enables a candidate who receives 50.01% (in fact, just a plurality) of the popular votes in the 11 most populous states to win a majority of the Electoral College (and hence the presidency).
That is, under the current system, a President could be elected with about 25% of the nationwide popular vote if one makes the politically preposterous assumption that the candidate receives 100% of the vote from each of the 11 states.[248]
Footnotes
[244] Von Spakovsky, Hans. 2011. Protecting Electoral College from popular vote. Washington Times, October 26, 2011.
[245] Weber, Brian Mark. 2020. The National Popular Vote Ruse. Patriot Post. September 4, 2020. https://patriotpost.us/articles/73202-the-national-popular-vote-ruse-2020-09-04
[246] After the 2020 census, it takes the 12 biggest states to get to a majority of the electoral votes. That is, Virginia must be added to the list of states shown in this section.
[247] Note that a statewide winner often wins a state with less than 50% of the vote when minor-party and/or independent candidates receive a substantial number of votes.
[248] The current state-by-state winner-take-all method of awarding electoral votes actually permits fewer than 25% of the voters to elect a President. According to calculations made by MIT Professor Alexander S. Belenky, using actual voter-turnout data, an Electoral College majority could have been won with between 16% and 22% of the national popular vote in the 15 elections between 1948 and 2004. Belenky, Alexander S. 2008. A 0-1 knapsack model for evaluating the possible Electoral College performance in two-party U.S. presidential elections. Mathematical and Computer Modelling. Volume 48. Pages 665–676.
9.4.2 MYTH: California and New York would dominate a national popular vote for President.
QUICK ANSWER:
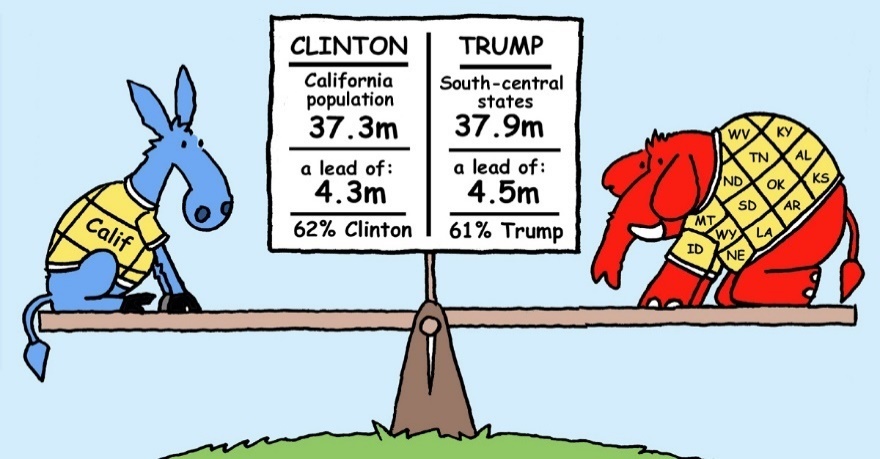
- It is a fact that California has about 37 million people and gave Hillary Clinton 62% of its votes and a popular-vote margin of 4.3 million votes in 2016. However, there is no reason to worry about California dominating a national popular vote for President, because the Republican Party enjoys an equally strong base of support elsewhere in the country. There is a bloc of Republican-leaning south-central states (which Nate Cohn christened “Appalachafornia”) with essentially the same population as California (37.9 million). These Republican-leaning states gave Donald Trump essentially the same percentage of its vote (61%) and essentially the same popular-vote margin (4.5 million). In 2020 and 2012, California was similarly counterbalanced by a group of Republican-leaning south-central states.
- If California’s Democratic popular-vote margin is worrisome, then the equivalent Republican popular-vote margin must also be. In a nationwide vote for President, votes from California and the equivalent Republican-leaning south-central states would be added together (along with votes from all the other states) to produce a nationwide popular vote. In the calculation of the national popular vote, California voters and those in the equivalent Republican-leaning area would balance each other out. Neither group of voters would be more influential, important, or controlling than the other.
- Similarly, there is no reason to worry about California and New York together dominating the nationwide outcome. A slightly larger group of Republican-leaning south-central states has the same population as California and New York combined. Those Republican-leaning states gave Trump essentially the same percentage of their vote and essentially the same popular-vote margin.
- Both California and the Republican-leaning south-central states have something in common. Because both areas give about 60% of their votes to their respective preferred parties, all the voters in both areas are ignored by general-election presidential candidates under the current state-by-state winner-take-all method of awarding electoral votes. Both California and the Republican-leaning south-central states would benefit from a nationwide vote, because presidential candidates would pay attention to their voters.
- The misplaced concern about California dominating a national popular vote arises from an exaggerated view of how many people live in California, how many people vote there, and how heavily Democratic the state is. One out of eight of the country’s voters lives in California, but four out of 10 of them vote Republican. Meanwhile, one out of eight voters lives in Appalachafornia, and four out of 10 of them vote Democratic. In fact, neither of these areas dominated a nationwide election in which 137 million votes were cast in 2016.
- The talking point about California has first-blush plausibility only because of the historical accident that there are only three states along the Pacific Coast, whereas the Atlantic Coast is divided among 14 states. If California had been admitted to the Union as six separate states (as was discussed at the time), the resulting six states would simply be average-sized states today. California was admitted to the Union as a single state in the pre-Civil-War era because of the then-delicate balance in the U.S. Senate between slave states and free states.
- Civil discourse is undermined by partisan talking points about alternative universes in which certain states are treated as if they are not legitimate parts of the United States. Every loser in every election would have won if carefully selected parts of his election district were excised from the vote count.
California has 37 million people and in 2016 gave Hillary Clinton 62% of its vote and a popular-vote margin of 4.3 million votes.
Some defenders of the current state-by-state winner-take-all method of awarding electoral votes have used Clinton’s large lead in California to argue that the state would monopolize the attention of presidential candidates and dominate the choice of President under the National Popular Vote Compact.
Bryan Fischer, a talk-show host on American Family Radio, said:
“America’s Founders knew if every presidential election was decided simply by the popular vote, the larger states such as California and New York would determine the outcome of every election until the end of time.”[249], [250]
Michigan State Representative Ann Bollin said the following about the National Popular Vote Compact in June 2024:
“The ultimate goal of this legislation is to force Michigan’s electoral votes to be determined by the national popular vote, effectively silencing the voices of Michigan residents in favor of those in other states like California or New York.”[251]
In an article in the New York Times after the 2016 presidential election, Nate Cohn wrote:
“Conservative analyst Michael Barone [said] the Electoral College serves as a necessary bulwark against big states, preventing California in particular from imposing ‘something like colonial rule over the rest of the nation.’”[252] [Emphasis added]
These statements overlook the fact that the Republican Party enjoys a virtually identical base of support in a different part of the country.
As political analyst Nate Cohn observed, there is a bloc of Republican-leaning south-central states with the same population as California that gave Trump essentially the same percentage of its vote and the same popular-vote margin as California gave Clinton in 2016.
Cohn gave the name “Appalachafornia” to these Republican-leaning states.[253]
The facts concerning Appalachafornia and California in 2016 are as follows:
- Both areas gave their favored candidate almost identical percentages of their popular vote (61% versus 62%, respectively).
- Both areas gave their favored candidate almost identical margins (4.5 versus 4.3 million votes, respectively).
- Both areas had almost identical populations (37.9 and 37.3 million, respectively). Appalachafornia had 12.25% of the country’s population of 309,785,186, while California had 12.05% (according to the 2010 census).
Table 9.8 shows that the Republican-leaning states of Appalachafornia had a combined population of 37,961,426, gave Trump 61% of their vote in 2016, and gave Trump a popular-vote margin of 4,475,297 votes.[254]
Table 9.8 Appalachafornia gave Trump a margin of 4,475,297 votes in 2016.
| State | Population 2010 | Clinton | Trump | Clinton percent | Trump percent | Trump margin |
| Alabama | 4,802,982 | 729,547 | 1,318,255 | 34% | 62% | 588,708 |
| Arkansas | 2,926,229 | 380,494. | 684,872. | 34% | 61% | 304,378 |
| Idaho | 1,573,499 | 189,765 | 409,055 | 27% | 59% | 219,290 |
| Kansas | 2,863,813 | 427,005 | 671,018 | 36% | 57% | 244,013 |
| Kentucky | 4,350,606 | 628,854 | 1,202,971 | 33% | 63% | 574,117 |
| Louisiana | 4,553,962 | 780,154 | 1,178,638 | 38% | 58% | 398,484 |
| Montana | 994,416 | 177,709 | 279,240 | 36% | 56% | 101,531 |
| Nebraska | 1,831,825 | 284,494 | 495,961 | 34% | 59% | 211,467 |
| North Dakota | 675,905 | 93,758 | 216,794 | 27% | 63% | 123,036 |
| Oklahoma | 3,764,882 | 420,375 | 949,136 | 29% | 65% | 528,761 |
| South Dakota | 819,761 | 117,442 | 227,701 | 32% | 62% | 110,259 |
| Tennessee | 6,375,431 | 870,695 | 1,522,925 | 35% | 61% | 652,230 |
| West Virginia | 1,859,815 | 188,794 | 489,371 | 26% | 69% | 300,577 |
| Wyoming | 568,300 | 55,973 | 174,419 | 22% | 68% | 118,446 |
| Total | 37,961,426 | 5,345,059 | 9,820,356 | 33% | 61% | 4,475,297 |
Table 9.9 shows that California had a population of 37,341,989, gave Clinton 61% of its vote, and gave Clinton a margin of 4,269,978 votes.
Table 9.9 California gave Clinton a margin of 4,269,978 votes in 2016.
| State | Population 2010 | Clinton | Trump | Clinton percent | Trump percent | Clinton margin |
| California | 37,341,989 | 8,753,788 | 4,483,810 | 62% | 32% | 4,269,978 |
Figure 9.3 shows that the political complexion of California is a mirror image of that of a bloc of Republican-leaning south-central states.
Mike Flanagan—flantoons@btinternet.com
In a nationwide vote for President, California would not assert “colonial rule” over the rest of the United States any more than the Republican-leaning south-central states (Appalachafornia) would.
In the calculation of the national popular vote, the votes from California and the essentially equivalent Republican-leaning area would balance each other out.
The misplaced concern about California “colonization” arises from an exaggerated view of how many people live in California, how many people vote there, and how heavily Democratic it is.
The facts are that one out of eight of the country’s voters lives in California, but four out of 10 of them vote Republican. Out of the 137,125,484 votes cast nationwide for President in 2016, there were 8,753,788 votes for Clinton in California.
Conversely, one out of eight voters lives in Appalachafornia, but four out of 10 of them vote Democratic. Out of the 137,125,484 votes cast nationwide for President in 2016, Trump received 9,820,356 votes from Appalachafornia.
To put it another way, there were 118,551,340 votes cast in places other than California and Appalachafornia together in 2016.
Ironically, the “colonial rule” that Barone bemoans is actually occurring today. Both California and the equivalent Republican-leaning area support their respective favored candidates at about the 60% level. That is, neither California nor the Republican-leaning states are closely divided. As a result, both California and the Republican-leaning states are routinely ignored by presidential candidates under the current state-by-state winner-take-all method of awarding electoral votes.
The decision as to who becomes President under the current system is not made by California or the bloc of south-central Republican-leaning states. It is made by the dozen-or-so closely divided battleground states.
If any states are exercising “colonial rule over the rest of the nation,” it is the battleground states, because they are the states that actually pick the President under the current system.
California and New York together were also equally balanced in 2016 with a slightly expanded Republican area.
There is a related myth involving California and New York together.
Michael Gomez, another defender of the current state-by-state winner-take-all method of awarding electoral votes, has extended the California “colonization” argument to include New York.
“Of Hillary Clinton’s reported 65,844,954 votes in the 2016 presidential election, 8,753,788 came from California. If California is subtracted from the equation, Donald Trump wins the national popular vote in the remaining 49 states by 1,404,903 votes. And if New York is also subtracted, Trump’s margin increases to 3,137,876. So, the notion that the NPVIC would make ‘every vote count’…, as its advocates affirm, is disproven when looking at the aforementioned raw number results.”[255] [Emphasis added]
Gomez’s argument is just as invalid as Barone’s.
If Nate Cohn’s Appalachafornia is expanded to include four additional Republican states (Indiana, Mississippi, Missouri, and South Carolina), the resulting “expanded Appalachafornia” has about the same population (58,098,701) as California and New York together (56,763,044 people). This “expanded Appalachafornia” area has 18.7% of the country’s population. California and New York together have 18.3%.
The facts in 2016 concerning the “expanded Appalachafornia” and California and New York together were:
- Both areas gave their favored candidates almost identical percentages of their popular vote (60% and 61%, respectively).
- Both areas gave their favored candidates almost identical margins (6,038,499 and 6,006,563 votes, respectively).
- Both areas had almost identical populations (58.1 and 56.8 million, respectively).
Table 9.10 shows that “expanded Appalachafornia” had a combined population of 58,098,701, gave Trump 60% of its vote in 2016, and gave Trump a margin of 6,038,499 votes.
Table 9.10 Expanded Appalachafornia gave Trump a margin of 6,038,499 votes in 2016.
| State | Population 2010 | Clinton | Trump | Clinton percent | Trump percent | Trump margin |
| Alabama | 4,802,982 | 729,547 | 1,318,255 | 34% | 62% | 588,708 |
| Arkansas | 2,926,229 | 380,494 | 684,872 | 34% | 61% | 304,378 |
| Idaho | 1,573,499 | 189,765 | 409,055 | 27% | 59% | 219,290 |
| Indiana | 6,501,582 | 1,033,126 | 1,557,286 | 37% | 60% | 524,160 |
| Kansas | 2,863,813 | 427,005 | 671,018 | 36% | 57% | 244,013 |
| Kentucky | 4,350,606 | 628,854 | 1,202,971 | 33% | 63% | 574,117 |
| Louisiana | 4,553,962 | 780,154 | 1,178,638 | 38% | 58% | 398,484 |
| Mississippi | 2,978,240 | 485,131 | 700,714 | 40% | 59% | 215,583 |
| Missouri | 6,011,478 | 1,071,068 | 1,594,511 | 38% | 60% | 523,443 |
| Montana | 994,416 | 177,709 | 279,240 | 36% | 56% | 101,531 |
| Nebraska | 1,831,825 | 284,494 | 495,961 | 34% | 59% | 211,467 |
| North Dakota | 675,905 | 93,758 | 216,794 | 27% | 63% | 123,036 |
| Oklahoma | 3,764,882 | 420,375 | 949,136 | 29% | 65% | 528,761 |
| South Carolina | 4,645,975 | 855,373 | 1,155,389 | 41% | 57% | 300,016 |
| South Dakota | 819,761 | 117,442 | 227,701 | 32% | 62% | 110,259 |
| Tennessee | 6,375,431 | 870,695 | 1,522,925 | 35% | 61% | 652,230 |
| West Virginia | 1,859,815 | 188,794 | 489,371 | 26% | 69% | 300,577 |
| Wyoming | 568,300 | 55,973 | 174,419 | 22% | 68% | 118,446 |
| Total | 58,098,701 | 8,789,757 | 14,828,256 | 36% | 60% | 6,038,499 |
Table 9.11 shows that California and New York had a combined population of 56,763,044, gave Clinton 61% of their votes, and gave Clinton a margin of 6,006,563 votes.
Table 9.11 California and New York together gave Clinton a margin of 6,006,563 votes in 2016.
| State | Population 2010 | Clinton | Trump | Clinton percent | Trump percent | Clinton margin |
| California | 37,341,989 | 8,753,788 | 4,483,810 | 62% | 32% | 4,269,978 |
| New York | 19,421,055 | 4,556,142 | 2,819,557 | 59% | 37% | 1,736,585 |
| Total | 56,763,044 | 13,309,930 | 7,303,367 | 61% | 33% | 6,006,563 |
Of course, there are numerous combinations of Republican states aside from Nate Cohn’s Appalachafornia that could be assembled to counterbalance California’s vote (and to counterbalance the combined votes of California and New York).
The reality is that 4.3% is the average margin in the national popular vote for President in the eight presidential elections between 1992 and 2020. That is, the presidential vote in the United States as a whole is divided approximately equally between the parties. By the way, 4% is approximately the margin of error of a typical national political poll. That is, typical recent presidential campaigns have usually been jump balls.
California and Appalachafornia were also equally balanced in 2012.
Barone’s “colonial rule” argument was equally invalid in 2012.
The facts concerning the Republican-leaning south-central states of Appalachafornia and California in 2012 are:
- Both areas gave their favored candidates almost identical percentages (61% and 60%, respectively) of their popular vote.
- Both areas gave their favored candidates similar margins (3.5 million and 3.0 million votes, respectively).
- Both areas had almost identical populations (37.9 million and 37.3 million, respectively).
Table 9.12 shows that the Republican states of Appalachafornia gave Romney 61% of their vote and a margin of 3,520,970 votes in 2012.
Table 9.12 Appalachafornia gave Romney a margin of 3,520,970 votes in 2012.
| State | Population 2010 | Obama | Romney | Obama percent | Romney percent | Romney margin |
| Alabama | 4,802,982 | 795,696 | 1,255,925 | 38% | 61% | 460,229 |
| Arkansas | 2,926,229 | 394,409 | 647,744 | 37% | 61% | 253,335 |
| Idaho | 1,573,499 | 212,787 | 420,911 | 33% | 65% | 208,124 |
| Kansas | 2,863,813 | 439,908 | 689,809 | 38% | 60% | 249,901 |
| Kentucky | 4,350,606 | 679,370 | 1,087,190 | 38% | 60% | 407,820 |
| Louisiana | 4,553,962 | 809,141 | 1,152,262 | 41% | 58% | 343,121 |
| Montana | 994,416 | 201,839 | 267,928 | 42% | 55% | 66,089 |
| Nebraska | 1,831,825 | 302,081 | 475,064 | 38% | 60% | 172,983 |
| North Dakota | 675,905 | 124,827 | 188,163 | 39% | 58% | 63,336 |
| Oklahoma | 3,764,882 | 443,547 | 891,325 | 33% | 67% | 447,778 |
| South Dakota | 819,761 | 145,039 | 210,610 | 40% | 58% | 65,571 |
| Tennessee | 6,375,431 | 960,709 | 1,462,330 | 39% | 59% | 501,621 |
| West Virginia | 1,859,815 | 238,269 | 417,655 | 36% | 62% | 179,386 |
| Wyoming | 568,300 | 69,286 | 170,962 | 28% | 69% | 101,676 |
| Total | 37,961,426 | 5,816,908 | 9,337,878 | 38% | 61% | 3,520,970 |
Table 9.13 shows that California gave Obama 61% of its vote and a margin of 4,269,978 votes in 2012.
Table 9.13 California gave Obama a margin of 3,014,327 votes in 2012.
| State | Population 2010 | Obama | Romney | Obama percent | Romney percent | Obama Margin |
| California | 37,341,989 | 7,854,285 | 4,839,958 | 60% | 37% | 3,014,327 |
California and Appalachafornia were also equally balanced in 2020.
The “colonial rule” argument was also invalid in 2020.
The facts concerning the Republican-leaning south-central states of Appalachafornia and California in 2020 are:
- Both areas gave their favored candidates identical percentages (63%) of their popular vote.
- Both areas gave their favored candidates similar margins (4.5 million for Appalachafornia and 5.1 million votes for California).
- Both areas had almost identical populations (39.9 and 39.5 million, respectively).
Table 9.14 shows that the Republican states of Appalachafornia (which had a 2020 population of 39,928,632) gave Trump 63% of their vote, and gave Trump a margin of 4,517,320 votes in 2020.
Table 9.14 Appalachafornia gave Trump a margin of 4,517,320 votes in 2020.
| State | Population 2020 | Biden | Trump | Biden percent | Trump percent | Trump Margin |
| Alabama | 5,024,279 | 849,624 | 1,441,170 | 37% | 63% | 591,546 |
| Arkansas | 3,011,524 | 423,932 | 760,647 | 35% | 64% | 336,715 |
| Idaho | 1,839,106 | 287,021 | 554,119 | 33% | 66% | 267,098 |
| Kansas | 2,937,880 | 570,323 | 771,406 | 42% | 57% | 201,083 |
| Kentucky | 4,505,836 | 772,474 | 1,326,646 | 36% | 63% | 554,172 |
| Louisiana | 4,657,757 | 856,034 | 1,255,776 | 40% | 59% | 399,742 |
| Montana | 1,084,225 | 244,786 | 343,602 | 41% | 58% | 98,816 |
| Nebraska | 1,961,504 | 374,583 | 556,846 | 39% | 60% | 182,263 |
| North Dakota | 779,094 | 114,902 | 235,595 | 32% | 67% | 120,693 |
| Oklahoma | 3,959,353 | 503,890 | 1,020,280 | 32% | 67% | 516,390 |
| South Dakota | 886,667 | 150,471 | 261,043 | 36% | 63% | 110,572 |
| Tennessee | 6,910,840 | 1,143,711 | 1,852,475 | 37% | 62% | 708,764 |
| West Virginia | 1,793,716 | 235,984 | 545,382 | 30% | 70% | 309,398 |
| Wyoming | 576,851 | 73,491 | 193,559 | 27% | 72% | 120,068 |
| Total | 39,928,632 | 6,601,226 | 11,118,546 | 37% | 63% | 4,517,320 |
Table 9.15 shows that California (with a 2020 population of 39,538,223), gave Biden 63% of its votes, and gave Biden a margin of 5,103,821 votes in 2020.
Table 9.15 California gave Biden a margin of 5,103,821 votes in 2020.
| State | Population 2020 | Biden | Trump | Biden percent | Trump percent | Biden Margin |
| California | 39,538,223 | 11,110,250 | 6,006,429 | 63% | 35% | 5,103,821 |
The talking point about California is the result of a historical accident that put most of the Pacific Coast in one state.
Barone’s talking point about California has first-blush plausibility because of the historical accident that there are only three states along the Pacific Coast, whereas there are 14 states on the Atlantic Coast.
In fact, just four of the 14 Atlantic Coast states (Florida, Georgia, South Carolina, and North Carolina) together have considerably more people than California. That is, there is nothing particularly eye-catching about California’s population other than the fact that it is contained in one state.
If California had been admitted to the Union as six separate states in 1850 (as was suggested at the time), the populations of none of the resulting six smaller states would be particularly noteworthy today.
California was admitted to the Union as a single state under the Compromise of 1850 because of the then-delicate political balance in the U.S. Senate between slave states and free states. There was talk of creating six new states when the California statehood convention convened in Monterey in September 1849.[256]
However, the political reality in Washington at the time was that the creation of even one new free state threatened to upset the existing delicate balance between the 15 slave states and 15 free states in the U.S. Senate.
Prior to 1850, the problem of balancing slave states and free states in the U.S. Senate had been finessed for by carefully orchestrating the admission of one new slave state with each new free state.[257]
For example, the Missouri Compromise of 1820 involved simultaneously admitting a slave state (Missouri) and a free state (Maine). In fact, the creative genius of the Missouri Compromise was to carve Maine out of Massachusetts’ existing territory in order to create the necessary new free state.[258]
Prior to the Missouri Compromise of 1820, Alabama and Illinois had been admitted to the Union in the preceding two years. Mississippi and Indiana had been admitted in 1816 and 1817.
After the Missouri Compromise of 1820, Arkansas and Michigan were admitted in 1836 and 1837. Later, two slave states (Texas and Florida) and two free states (Wisconsin and Iowa) were admitted between 1845 and 1848.
Up to 1850, the slave states had maintained parity with the free states in the U.S. Senate. However, by 1850, the free states commanded a clear and growing majority in both the U.S. House of Representatives and the Electoral College.
In 1850, there was no suitable prospective slave state available to balance out the admission of even one new free state—much less six new free states.
The possibility of creating more than one state out of the territory that is now California was foreclosed because one of the Monterey convention’s first acts was the unanimous adoption of a prohibition against slavery.
The resulting political crisis preoccupied Congress for nine months in 1850 (during which almost no other business was transacted).
The eventual Compromise of 1850 involved admitting the huge area that is now California as a single free state—thereby upsetting the 15–15 balance in the U.S. Senate by only one state. Meanwhile, the South was placated with the enactment of a harsh federal Fugitive Slave Law, a financial bailout of the slave state of Texas, and other concessions.[259]
The result of the Compromise of 1850 was that the population of the Pacific Coast today is largely concentrated in the single state of California.
Democracy is undermined by political talking points about alternative universes in which certain voters are treated as illegitimate.
In an article entitled “If Only You Couldn’t Vote,” Mark Mellman wrote:
“A favorite meme in Trump World argues that if it weren’t for California, Hillary Clinton would have lost the national popular vote for president, which she won by almost 3 million ballots. … Of course, it’s also true that without … Texas and Alaska, Trump would have lost the Electoral College along with the popular vote. … Such attempts to fashion an alternate universe attack a fundamental tenet of American democracy. …Pitting urban against rural, Texas against California, rips the ‘United’ out of the United States.”[260] [Emphasis added]
This recently minted partisan talking point has seeped into state-level politics as well. After Wisconsin Governor Scott Walker (R) lost his 2018 re-election race, Assembly Speaker Robin Vos (R) said:
“If you took Madison and Milwaukee out of the state election formula, we would have a clear majority.”[261]
However, as Mellman pointed out,
“Without Waukesha, Washington and Ozaukee counties, Scott Walker would not have been elected Governor in the first place.”[262]
Indeed, every loser in every election would have won if carefully selected parts of the election district had been excised from the vote count.
Footnotes
[249] Fischer, Bryan. 2020. How the Electoral College is supposed to work. OneNewsNow. January 24, 2020. https://onenewsnow.com/perspectives/bryan-fischer/2020/01/24/how-the-electoral-college-is-supposed-to-work
[250] The Founding Fathers were indeed prescient because, at the time the Constitution was written, New York was only the fifth largest state according to the 1790 census. Schedule of the Whole Number of Persons within the Several Districts of the United States. 1793. Page 3. https://www.census.gov/library/publications/1793/dec/number-of-persons.html
[251] Bollin, Ann. 2024. Press Release: Rep. Bollin reaffirms strong opposition to National Popular Vote compact. June 12, 2024. https://gophouse.org/posts/rep-bollin-reaffirms-strong-opposition-to-national-popular-vote-compact
[252] Cohn, Nate. Why Trump Had an Edge in the Electoral College. New York Times. December 19, 2016. http://www.nytimes.com/2016/12/19/upshot/why-trump-had-an-edge-in-the-electoral-college.html
[253] Ibid.
[254] For this table and similar tables in this section, the percentages in columns 5 and 6 are of the total vote.
[255] Gomez, Christian. National Popular Vote Compact Threatens Republic. The New American. February 1, 2017. http://www.thenewamerican.com/usnews/constitution/item/25202-national-popular-vote-compact-threatens-republic
[256] Bordewich, Fergus M. 2012. America’s Great Debate: Henry Clay, Stephen A. Douglas, and the Compromise that Preserved the Union. New York, NY: Simon & Schuster. Page 50.
[257] Ibid. Page 12.
[258] Ibid. Pages 76–79.
[259] The Compromise of 1850 also included settling a boundary dispute in the Southwest and abolishing the slave trade (but not slavery) in the District of Columbia (the only tangible result of which was that the slave markets moved across the Potomac River to Virginia).
[260] Mellman, Mark. 2018. If only you couldn’t vote. The Hill. December 18, 2018. https://thehill.com/opinion/campaign/421996-mellman-if-only-you-couldnt-vote
[261] Ibid.
[262] Ibid.
9.4.3 MYTH: A candidate’s entire nationwide margin could come from just one state in a nationwide presidential election.
QUICK ANSWER:
- It is true that a candidate’s entire national-popular-vote margin came from just one state in six of the 50 presidential elections between 1824 and 2020. However, one candidate’s entire electoral-vote margin came from just one state in 17 elections—about three times as often.
- This myth is one of many examples in this book of a criticism aimed at the National Popular Vote Compact where the Compact is actually slightly superior to the current system.
There have been six instances in the 50 presidential elections between 1824 and 2020 in which a candidate’s entire national-popular-vote margin came from just one state, as shown in table 9.16.[263], [264]
Table 9.16 There have been six presidential elections in which a candidate’s entire national-popular-vote margin came from just one state.
| Year | State | Candidate who won the state | Party | Popular-vote margin of the national popular vote winner | Popular-vote margin of the national popular vote winner coming from the state |
| 2016 | California | Clinton | D | 2,868,518 | 4,269,978 |
| 2000 | California | Gore | D | 543,816 | 1,293,774 |
| 1960 | Massachusetts | Kennedy | D | 118,574 | 510,424 |
| 1888 | Texas | Cleveland | D | 89,283 | 142,219 |
| 1884 | Texas | Cleveland | D | 62,670 | 133,030 |
| 1880 | Iowa | Blaine | R | 8,355 | 78,059 |
However, one presidential candidate’s entire electoral-vote margin came from just one state in 17 elections—about three times as often, as shown in table 9.17.
Table 9.17 There have been 17 presidential elections in which a candidate’s entire electoral-vote margin came from just one state.
| Year | State | Candidate who won the Electoral College | Party | Electoral-vote margin of the Electoral College winner | Electoral-vote margin of the Electoral College winner coming from the one state | |
| 2004 | Ohio | G.W. Bush | R | 16 | 20 | |
| 2000 | Florida | G.W. Bush | R | 1 | 25 | |
| 1976 | California | Carter | D | 27 | 45 | |
| 1968 | California | Nixon | R | 31 | 40 | |
| 1960 | New York | Kennedy | D | 34 | 45 | |
| 1948 | New York | Truman | D | 37 | 47 | |
| 1916 | Ohio | Wilson | D | 11 | 24 | |
| 1888 | New York | B. Harrison | R | 32 | 36 | |
| 1884 | New York | Cleveland | D | 18 | 36 | |
| 1880 | New York | Garfield | R | 29 | 35 | |
| 1876 | New York | Hayes | R | 0 | 35 | |
| 1860 | New York | Lincoln | R | 28 | 35 | |
| 1856 | New York | Buchanan | D | 25 | 35 | |
| 1848 | New York | Taylor | Whig | 17 | 36 | |
| 1844 | New York | Polk | D | 32 | 36 | |
| 1836 | New York | Van Buren | D | 22 | 42 | |
| 1824 | Pennsylvania | Jackson | D | 15 | 28 | |
Note that one candidate’s entire electoral vote margin came from just one state in four of the five elections in which that candidate failed to win the most popular votes nationwide (2000, 1888, 1876, and 1824).
This myth is one of many examples in this book of a criticism aimed at the National Popular Vote Compact where the Compact is actually slightly superior to the current system.
Footnotes
[263] This comparison starts at 1824, because that was the first year in which a majority of the states (18 of 24) conducted popular elections for presidential elector. By 1828, 22 of the 24 states conducted popular elections.
[264] In 1824, Andrew Jackson led John Quincy Adams in the Electoral College 99–84 (and also led in the national popular vote); however, no candidate received an absolute majority in the Electoral College, because William H. Crawford and Henry Clay also won electoral votes from various states.
9.4.4 MYTH: Eleven colluding big states are trying to impose a national popular vote on the country.
QUICK ANSWER:
- The asserted “collusion” among the nation’s 11 biggest states is demonstrably false, as evidenced by the actual list of states that have adopted the National Popular Vote Compact. As of July 2024, the Compact has been enacted into law by six small states, nine medium-sized states, and three big states.
- If anyone considers the fact that the 11 biggest states possess a majority of the electoral votes represents a danger in terms of adopting the National Popular Vote Compact, this same fact must be regarded as an argument against the current state-by-state winner-take-all method of electing the President. Indeed, these same 11 states could, if they were to act in concert, elect a President in every presidential election.
Tara Ross, a lobbyist against the National Popular Vote Compact who works closely with Save Our States, has criticized the Compact on the grounds that “11 colluding states” could, if they were to act in concert, impose a national popular vote on the country.
The 11 biggest states did indeed possess a majority of the electoral votes—270 of 538, according to the 2010 census.[265]
First, the actual list of states that have adopted the National Popular Vote Compact demonstrates that Ross’ claimed “collusion” among the nation’s 11 biggest states is untrue.
As of July 2024, only four of the 11 biggest states have enacted the National Popular Vote Compact.
Specifically, the Compact has been enacted into law by 18 jurisdictions together possessing 209 electoral votes:
- six small states
- Delaware–3
- District of Columbia–3
- Hawaii–4
- Maine–4
- Rhode Island–4
- Vermont–3
- nine medium-sized states
- Colorado–10
- Connecticut–7
- Maryland–10
- Massachusetts–11
- Minnesota–10
- New Jersey–14
- New Mexico–5
- Oregon–8
- Washington–12
- three big states
- California–54
- Illinois–19
- New York–28
Second, the 11 biggest states have little in common with one another politically. They rarely act in concert on policy issues. These disparate 11 states rarely agree on a choice for President.
Table 9.18 shows the distribution of the 11 biggest states carried by the Republican and Democratic nominees.
Table 9.18 Winner of the 11 biggest states 2000–2020
| Election | Republican | Democratic |
| 2000 | TX, FL, OH, GA, NC | CA, NY, IL, PA, MI, NJ |
| 2004 | TX, FL, OH, GA, NC | CA, NY, IL, PA, MI, NJ |
| 2008 | TX, GA | CA, NY, FL, IL, PA, OH, MI, NC NJ |
| 2012 | TX, GA. NC | CA, NY, FL, IL, PA, OH, MI, NC NJ |
| 2016 | TX, FL, OH, MI, GA, NC, PA | CA, NY, IL, NJ |
| 2020 | TX, FL, OH, NC | CA, NY, IL, PA, MI, GA, NJ, |
Ross considers the fact that the 11 biggest states possess a majority of the electoral votes to be dangerous in terms of adopting the National Popular Vote Compact. If so, this same fact should also be considered as a reason to abandon the current system of electing the President, because these same 11 states could (if they ever were to act in concert) impose their choice for President on the country in every presidential election.
Indeed, a mere plurality of voters in states possessing a majority of the electoral votes are sufficient to produce a majority in the Electoral College under the current state-by-state winner-take-all method of awarding electoral votes.
Footnotes
[265] After the 2020 census, it takes the 12 biggest states to get to a majority of the electoral votes. That is, Virginia must be added to the list of states shown in this section.