Opponents of a national popular vote for President often claim that California and New York would dominate a nationwide vote.
It is true that these two big states regularly produce a multi-million vote lead in favor of the Democratic presidential candidate. California and New York together have 59.7 million people—18% of the U.S. population according to the 2020 census. In 2024, California and New York together gave Harris 59% of their two-party popular vote—an impressive lead of 4.2 million votes for Harris.
However, these two states contain only 18% of the U.S. population. Opponents are far from presening a complete or accurate picture of the American electorate.
In particular, there is a group of “Very Red States” that also have 18% of the U.S. population—that is, essentially the same population as California and New York. This 18% portion of the country gave Trump 63% of its popular vote in 2024—a lead of 6.8 million votes for Trump.
That is, the “Very Red States” gave Trump a bigger lead—both in terms of number of votes and percentage—than California and New York gave Harris.
In short, California and New York would not dominate a nationwide vote for President.
Why aren't the opponents of a national popular vote for President talking about how the "Very Red States" are going to dominate presidential elections?
Click here to see detailed tables of the groups of states referred to on this page.

Moreover, there’s more to the United States than the above two groups.
Three additional groups of voters—each having about a fifth of the population—complete the picture of the American electorate.
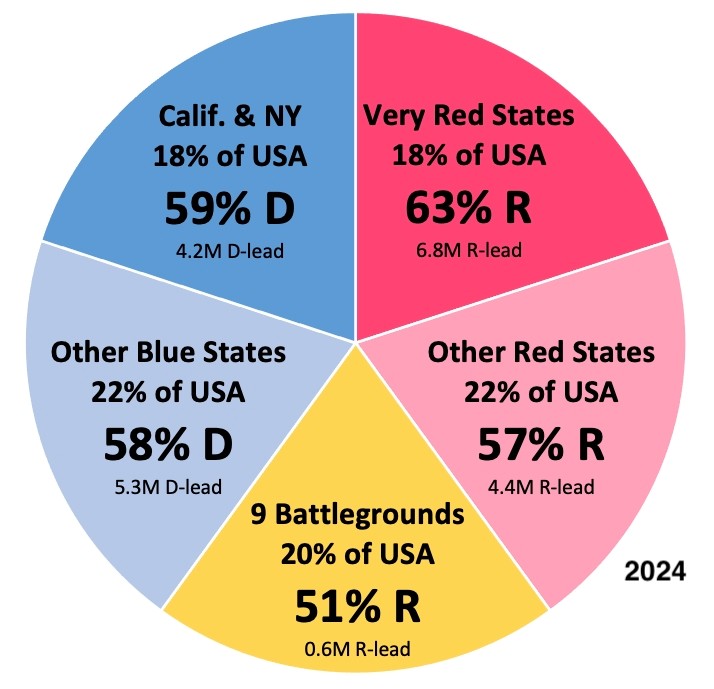
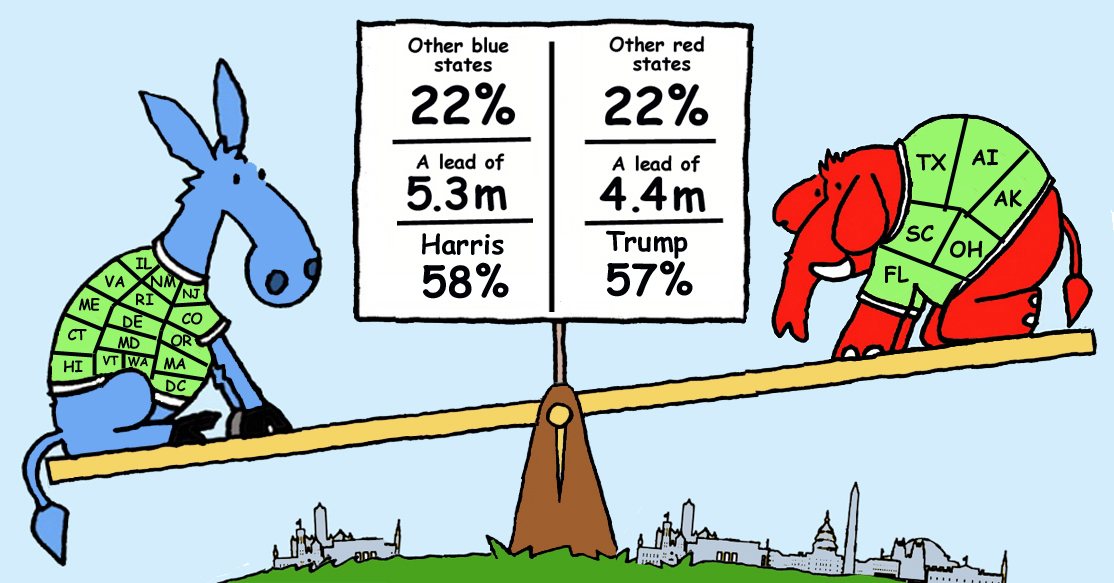
The third group consists of 16 “other blue states.” This group has 22% of the U.S. population. This group gave Harris 58% of their popular vote in 2024—a lead of 5.3 million votes.
The fourth group consists of six “other red states.” This group also has 22% of the U.S. population. This group gave Trump 57% of their popular vote in 2024—a lead of about 4.4 million votes.
In other words, the “Other Blue States” and the “Other Red Sates” essentially balance each other out quite closely—just as California and New York the “Very Red States” balance each other out quite closely.
Finally, the fifth group consists of nine most closely divided “battleground” states. Each of these nine states could plausibly have gone to either party in 2024. This group of states has the remaining fifth of the U.S. population. In 2024, these states gave Trump 50.8% of their two-party popular vote—a lead of 600,392 votes.
Under the current state-by-state winner-take-all method of awarding electoral votes, the nine battleground states received almost all (96%) of the campaign activity of the presidential campaign—251 of the 262 general-election campaign events in 2024. Meanwhile, presidential campaigns gave the first four groups (representing 80% of the American electorate) only 11 of the 262 general-election campaign events.

In summary, the national popular vote is the result of adding up the popular votes from all five groups.
|
Republican 2024 percent of two-party vote |
Population |
Group |
Trump |
Harris |
Lead |
|
41% |
59,739,472 |
California and New York |
9,660,596 |
13,895,374 |
₋₋4,234,778 |
|
63% |
59,101,968 |
Very Red States |
16,400,547 |
9,554,278 |
6,846,269 |
|
42% |
73,617,332 |
Other Blue States |
14,908,251 |
20,187,115 |
₋₋ 5,278,864 |
|
57% |
71,525,325 |
Other Red States |
18,279,063 |
13,927,744 |
4,351,319 |
|
50.8% |
67,465,184 |
Battleground States |
18,055,112 |
17,454,720 |
600,392 |
|
50.7% |
331,449,281 |
Total |
77,303,569 |
75,019,231 |
2,284,338 |
Additional Discussion concerning Hillary Clinton's Win in California in 2016
Opponents of a national popular vote for President have been raising similar invalid arguments about past elections.
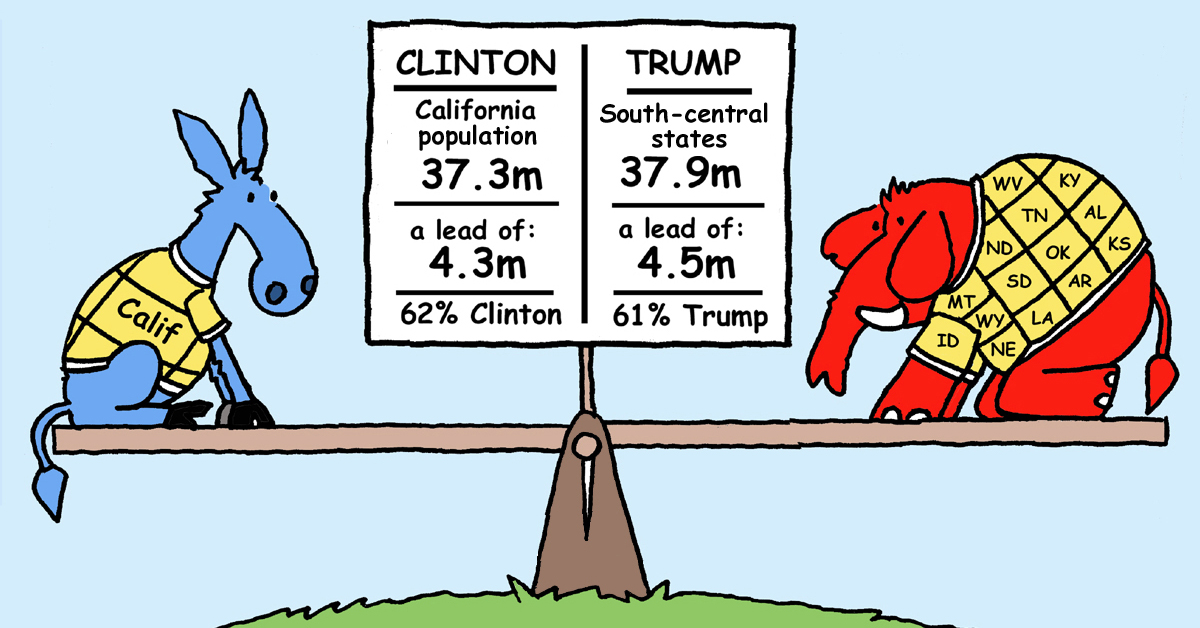
● In 2016, there was a Republican-leaning area in the south-central part of the country that has the same population as California and that gave Trump essentially the same percentage of its vote (and the same popular-vote margin) as California gave Clinton in 2016.
● It is a fact that California had about 37 million people at the time, and that California gave Hillary Clinton 62% of its vote and a popular-vote margin of 4.3 million votes in 2016. It is also a fact that California is counter-balanced by an equally populous Republican area in the south-central part of the country (which Nate Cohn called “Appalachafornia”) with 37 million people that gave Trump essentially the same percentage of its vote (61%) and essentially the same popular-vote margin (4.5 million).
● The misplaced concern about California dominating a national popular vote arises from an exaggerated view of how many people live in California, how many people vote in California, and how heavily Democratic California is. One out of eight U.S. voters live in California, but four out of 10 of them vote Republican. Meanwhile, one out of eight U.S. voters live in Appalachafornia, and four out of 10 of them vote Democratic. Clinton received 8.8 million votes in California, and Trump received 9.8 million votes from Appalachafornia. To put these numbers in perspective, note that over 137 million votes were cast in the 2016 presidential election.
● The political talking point that focuses on the seemingly large role of California in presidential elections arises from the historical accident that it occupies most of the Pacific Coast, whereas there are 14 states along the Atlantic Coast. California was admitted to the Union as a single state under the Compromise of 1850 because of the then-delicate balance between slave states and free states in the U.S. Senate. If California had been admitted as six separate states (as was suggested at the time), California’s population today would be no more noteworthy than that of such Atlantic coast states as Florida, Georgia, South Carolina, and North Carolina (which, by the way, have a greater population than California).
● Political talking points about alternative universes in which certain voters are removed undermine political discourse. Every loser in every election would have won if some carefully selected portion of the other candidate’s voters were excluded from the vote count.
Click here for a more detailed discussion in section 9.4.2 (page 719) of Every Vote Equal book.